Precipitation
Based on the provisional data, the statewide average rainfall for September was 0.78 inches, 2.45 inches below normal and the 5th driest September on record. The driest September was 1979 with 0.46 inches. Statewide records go back to 1895.
Total monthly rainfall ranged from 4.16 inches at the Rock Island Lock and Dam to only 0.01 inches at Springfield Airport.
It was also the 4th driest August-September for Illinois with a statewide average rainfall of 3.11 inches, which is 3.70 inches below normal.
As a result of the dryness, especially in the last two months, the US Drought Monitor has about 80 percent of Illinois as “abnormally dry” D0 and 13 percent in “moderate drought” D1.
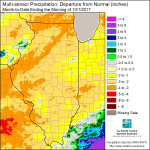
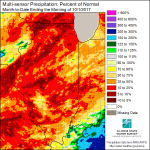
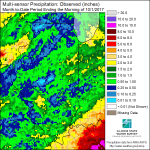
Estimated from radar and rain gage data, these maps below show that nearly all of Illinois had below normal rainfall in September. If you look closely, you can see that the only wet areas were around the Quad Cities and a few spots along the Ohio River. The area along the Ohio River benefitted from the remnants of Hurricane Harvey. Click to enlarge.
Temperature
The statewide average temperature for Illinois was 68.7 degrees, 2.5 degrees above normal and the 28th warmest September on record. While the month started out on the cool side, a late-season heat wave struck in the second half of September with a number of sites routinely reporting highs in the mid to upper 90s. Some of the warmest readings in the state were at Effingham and Neoga when they both reported a high of 98 degrees on September 23.
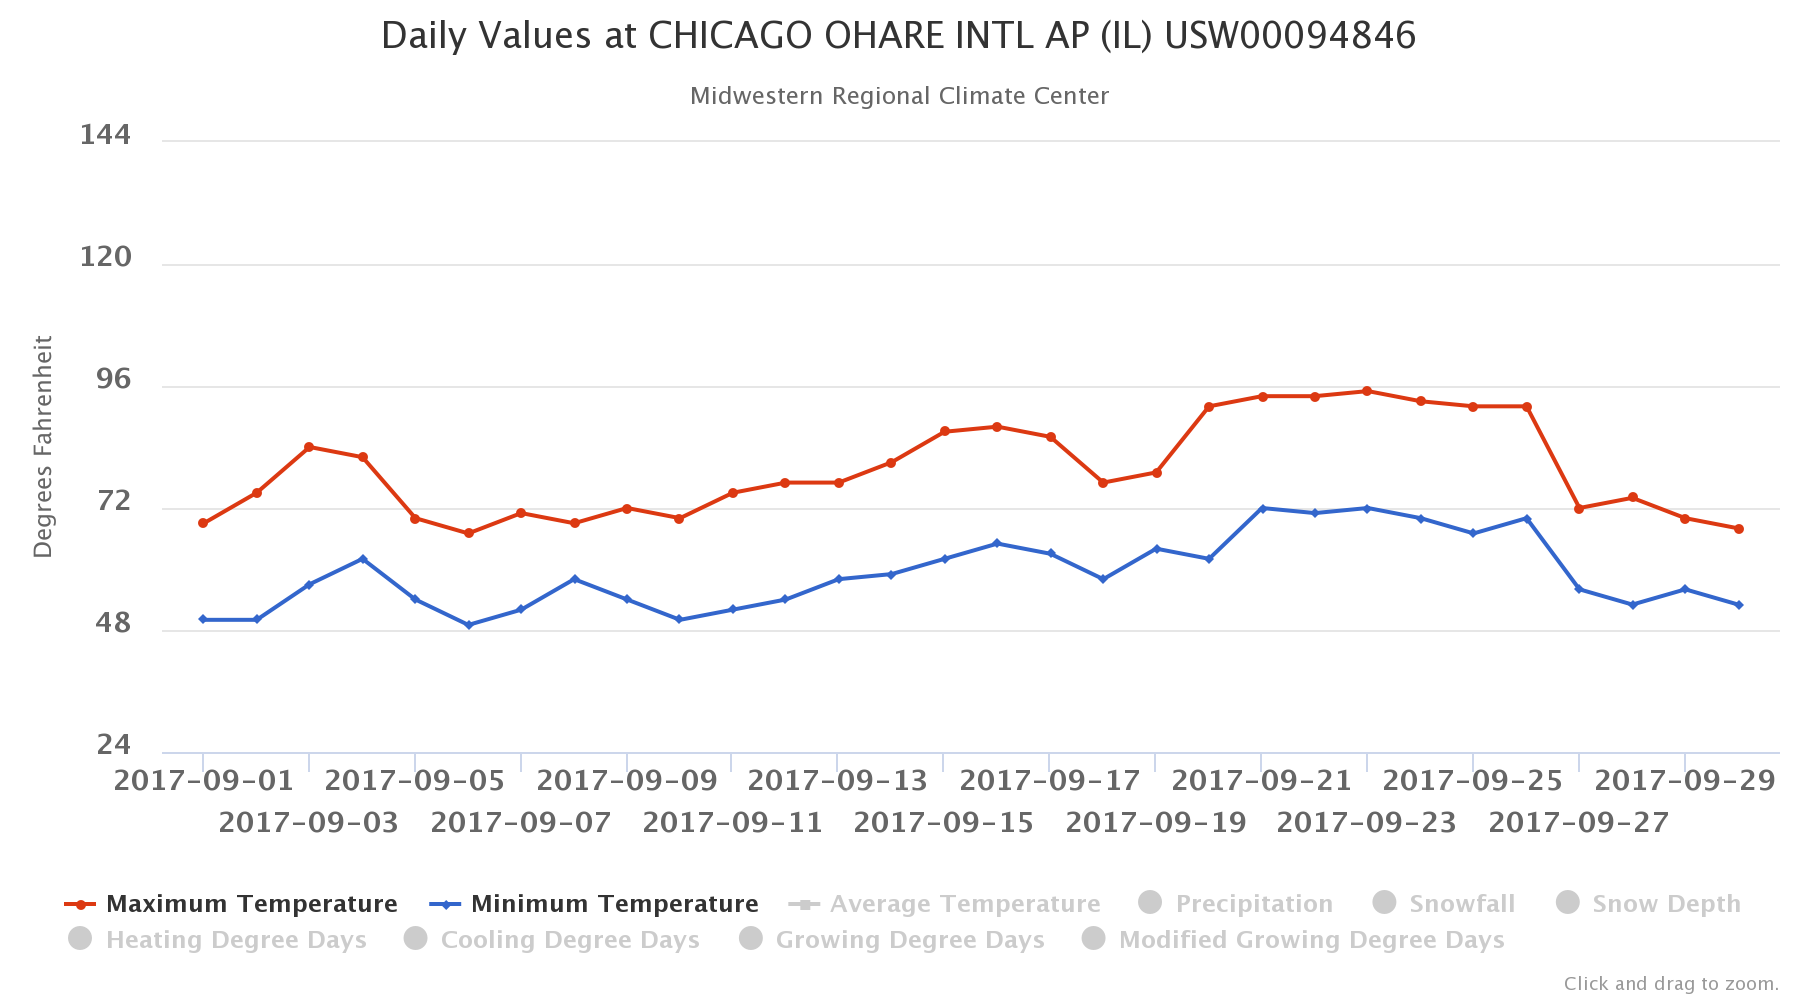
Here is the table showing the daily record highs set in September at Chicago O’Hare, followed by the chart showing the high and low temperatures for Chicago O’Hare for the month of September. Other locations experienced similar conditions in terms of the timing and intensity of the heat.
- 9/20: 90 degrees
- 9/21: 94 degrees
- 9/22: 94 degrees
- 9/23: 95 degrees
- 9/24: 93 degrees
- 9/25: 92 degrees
- 9/26: 92 degrees
Statewide, many stations tied or broke daily high-temperature records with the September heat wave. In all, 202 records were broken and another 71 were tied in Illinois, based on the potential number of stations with long-term records. You can check out the NCEI tool here.
USDA NASS Soil Moisture report
According to the September 25 NASS report, Illinois topsoil moisture was reported at 32 percent “very short” and 45 percent “short”. Subsoil moisture was reported at 23 percent “very short” and 50 percent “short”. Low soil moisture this time of year may benefit the fall harvest of corn and soybeans. However, it could make it harder to establish winter wheat and fall cover crops if the dryness continues. In most cases, soil moisture can recover later in the fall and on into winter as the demands on soil moisture go to zero. 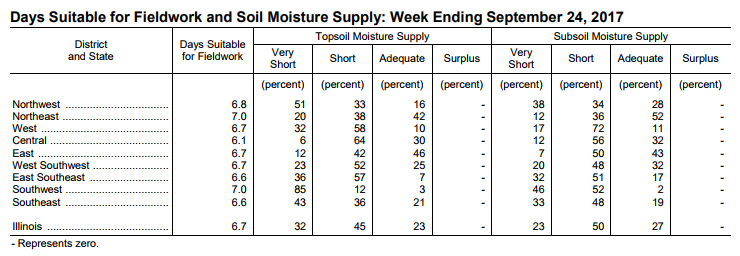
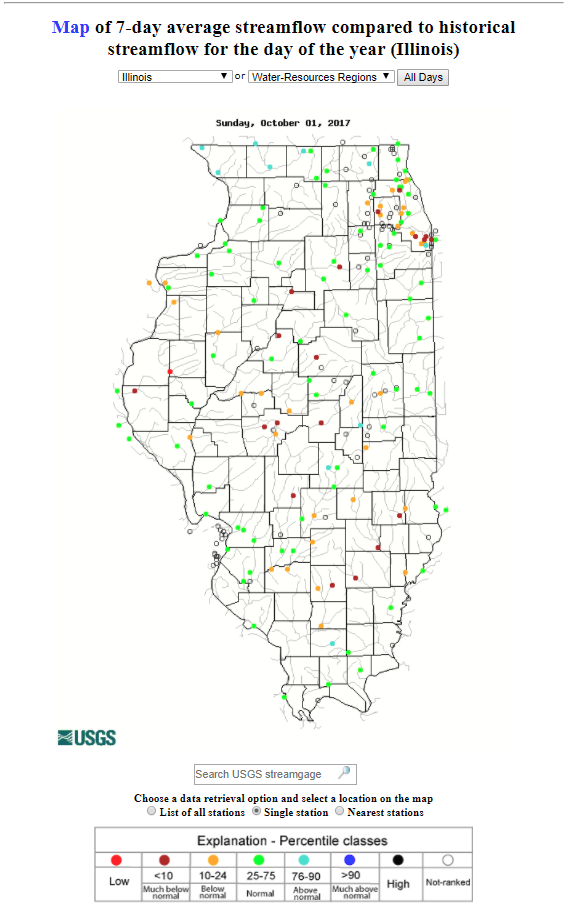
USGS Streamflow
Here is the USGS 7-day average streamflow, showing several rivers and streams across Illinois at below normal to much below normal flows for this time of year.
Outlook for October
The NWS updated their outlook for October on Saturday, indicating that there is an increased chance that October will be warmer than normal for all of Illinois and the eastern half of the US, as well as the Southwest. For precipitation, northern Illinois is near the region with an increased chance of wetter weather that extends across the upper Midwest and the High Plains. Meanwhile, southern Illinois is in an area with an increased chance of drier weather that is roughly aligned with the Ohio River Valley.
With this kind of forecast (warm and dry), soil moisture, streamflows, lake, and pond levels are not likely to improve over the next month and are more likely to deteriorate across Illinois.