New Seasonal Outlooks for Fall and Winter

The NWS Climate Prediction Center released their new monthly and seasonal outlooks for October, October-December, and January-March. Illinois has an increased chance of having above-normal temperatures for the rest of 2016. That is no surprise since every month in 2016, except May, has been above-normal for Illinois.
According to the NWS, the current ocean/atmosphere conditions in the Pacific reflect so-called ENSO-neutral conditions. This means that we are not in El Niño or La Niña conditions. There is only a 55-60 percent chance of La Niña showing up this fall or winter. And if it does show up, it is likely to be a weak event.
In the NWS forecasts, the term equal chances (EC) is used to identify areas where there is no clear signal of how temperature or precipitation might behave. The other way to look at it is that those are areas without an increased risk of being much above or below normal.
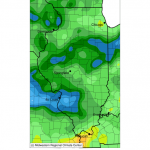
October

Continue reading “New Seasonal Outlooks for Fall and Winter”

September – Wetter, Warmer than Normal

September so far in Illinois has been warmer than normal with areas of widespread rain. The statewide average temperature is 72.4 degrees, 1.9 degrees above normal. The statewide average precipitation is 2.03 inches, 0.99 inches above normal.

Rainfall

The rains in September have been widespread across the state with heavier amounts of 3 to 5 inches east of St. Louis and across central Illinois (left panel, blue shading). That is about 1 to 3 inches above normal for the first 12 days of September (right panel, darker green shading). Click to enlarge.

Temperature

Continue reading “September – Wetter, Warmer than Normal”

Wettest August, Wettest July-August in Illinois

Summary: Illinois has experienced its wettest August (6.89 inches) and wettest July-August (13.74 inches) on record.

August

The statewide average rainfall for August was 6.89 inches, 3.30 inches above normal and the wettest August on record. It just beat the old record of 6.86 inches set back in 1977. The rainfall for this August is based on preliminary data and may change in the next several days as late reports trickle in. The highest rainfall total with reports on all 31 days was Sterling (IL-LE-5) with 14.01 inches from the CoCoRaHS network.
The statewide average temperature for August was 75.9 degrees, 2.3 degrees above normal. That is tied with 1943 as the 15th warmest August on record. The average high temperatures were close to normal. In fact, most of Illinois never got hotter than the low to mid-90s in August. However, the high humidity levels did not allow temperatures to cool off at night. As a result, nighttime temperatures were 3 to 5 degrees above normal.

July-August

Combine a very wet July with a very wet August, and you have the wettest July-August on record. The rainfall total of July-August was 13.74 inches, which is 6.07 inches above normal. It beat out the old record for July-August of 12.83 inches, set back in 1915. The highest 2-month rainfall total was Downers Grove (IL-DP-135) with 22.93 inches of rain.

Maps

Continue reading “Wettest August, Wettest July-August in Illinois”