

Summary: Illinois has experienced its wettest August (6.89 inches) and wettest July-August (13.74 inches) on record.
August
The statewide average rainfall for August was 6.89 inches, 3.30 inches above normal and the wettest August on record. It just beat the old record of 6.86 inches set back in 1977. The rainfall for this August is based on preliminary data and may change in the next several days as late reports trickle in. The highest rainfall total with reports on all 31 days was Sterling (IL-LE-5) with 14.01 inches from the CoCoRaHS network.
The statewide average temperature for August was 75.9 degrees, 2.3 degrees above normal. That is tied with 1943 as the 15th warmest August on record. The average high temperatures were close to normal. In fact, most of Illinois never got hotter than the low to mid-90s in August. However, the high humidity levels did not allow temperatures to cool off at night. As a result, nighttime temperatures were 3 to 5 degrees above normal.
July-August
Combine a very wet July with a very wet August, and you have the wettest July-August on record. The rainfall total of July-August was 13.74 inches, which is 6.07 inches above normal. It beat out the old record for July-August of 12.83 inches, set back in 1915. The highest 2-month rainfall total was Downers Grove (IL-DP-135) with 22.93 inches of rain.
Maps
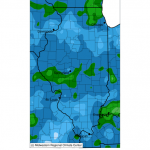
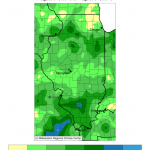
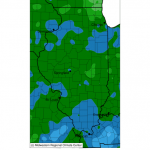
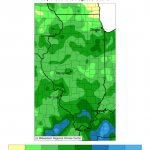
Here are the August rainfall amounts and departures from normal (click to enlarge). The shades of blue indicate rainfall totals in excess of 5 inches (left panel), while the shades of green show rainfall totals that are above normal (right panel). Illinois is a sea of blue and green in these maps, which may be appropriate since all you see outside is either water or lush vegetation. There are two bands of higher monthly totals – one across northern along Interstate 80 and a second band across southern Illinois – where amounts exceeded 10 inches.
Here are the average high and low-temperature departures from normal for August, showing how the daytime highs were close to normal while the nighttime temperatures were 3 to 5 degrees above normal thanks to the high humidity. Click to enlarge.
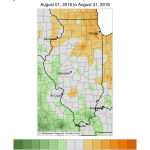
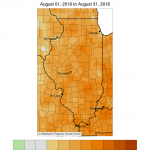
Below are the rainfall totals and departures from normal for July-August. Almost the entire state is dark green or blue on the left panel, meaning rainfall was in the range of 15 to 25 inches. The rainfall departures, right panel, were almost all green, indicating that rainfall was above normal for almost the entire state, except for small portions of Lake and McHenry counties. The darkest shade of green in southern Illinois, south of Chicago, and northeast of St. Louis were 9 to 12 inches above normal and the area in blue in southern Illinois was 12 to 15 inches above normal.
Dewpoint Temperatures
The dewpoint temperature is the temperature you would have to cool the air for condensation or dew to form. It is one of my favorite ways of measuring humidity because it is an absolute number. Relative humidity is a terrible measure, IMO, because it is relative to the air temperature as well as the water content. For example, the other morning we experienced 100% humidity with low-lying fog. The air temperature was 70 degrees and the dewpoint temperature was 70 degrees. However, as it warmed up to 83 degrees in the afternoon, the relative humidity dropped to 67% even though the dewpoint temperature remained at 70 degrees.
My rule of thumb is that dewpoint temperatures in the 60s are uncomfortable, regardless of the air temperature, and become miserable when the dewpoint temperatures get into the 70s. The average dewpoint temperature for August ranged from the low to mid 70s in southern Illinois, the mid 60s to low 70s in much of the rest of the state (left panel). That is about 1 to 3 degrees above normal (right panel). So, yes, it was more humid than usual in August. These maps are produced by the PRISM climate group at Oregon State. Click to enlarge.

Precipitable Water
One of the concepts in meteorology is called precipitable water. Imagine a column of air above you and that you could wring out all the water vapor in the column in the form of rain. That amount is called precipitable water. It provides a measure of how much water is available for storms*.
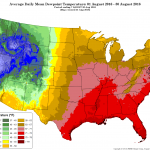
Below are the maps of the average daily precipitable water and departures from normal for August. The units are a bit obtuse: kg per meters squared, which converts directly to millimeters of water. On an average day in Illinois, we had 35 to 45 millimeters (1.4 to 1.8 inches) of precipitable water, which was about 4 to 8 millimeters (.2 to .3 inches) more than normal. That is per day and works out to be about 10-15 percent extra moisture in Illinois for passing thunderstorms to tap into in August.
*Storms can produce more rainfall than what is indicated by the precipitable water by pulling in water vapor from the surrounding area. However, the precipitable water does correlate well with the amounts generated in storms (e.g., high rainfall amounts are linked to high precipitable water amounts and vice verse).