[edited 3/8/16 based on feedback]
There have been some mention in the ag media about the linkage between above-average November-December precipitation and lower below-trend corn yields for the next summer (usually understood to be related to some form of drought). It’s an intriguing case because the drought of 2012 was preceded by a wet November-December. However, when you dig into the statistics, the relationship is more complicated.
For this comparison I looked at the 11 wettest November-December events for the Corn Belt (map at bottom)and the US corn yield from the USDA. I picked the top 11 wettest because it gives us 10 previous cases to examine.
The 11 Wettest Corn-Belt November-December
- 2015 with 7.17 inches
- 1982 with 6.59 inches
- 1983 with 5.95 inches
- 1909 with 5.93 inches
- 1985 with 5.78 inches
- 1931 with 5.76 inches
- 1992 with 5.53 inches
- 1972 with 5.25 inches
- 1990 with 4.98 inches
- 2011 with 4.94 inches
- 1973 with 4.83 inches
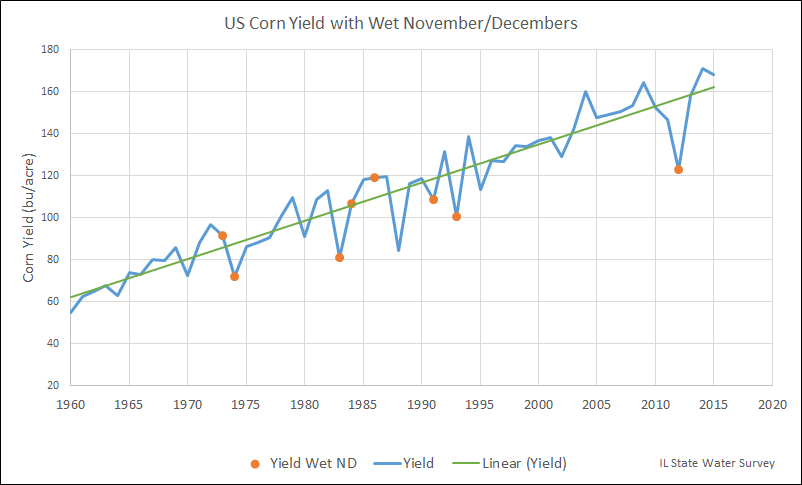
Here are how the corn yields for the growing season following a wet November-December looks like (orange dots), compared to all corn yields (blue line), and the yield trend (green line). We did not consider yields in 1910 or 1932 since those predated modern hybrids. Of the remaining 8, 1974, 1983, 1991, and 2012 experienced below-trend yields from drought and 1993 experienced below-trend yields from flooding.