

In an earlier post we examined the NWS Climate Prediction Center forecasts through next summer that included the statement, “Illinois has a higher risk of being both warmer and drier than average through mid-summer. There is an increased risk of being warmer than average in late summer and in fall.”
Taken at face value, the NWS forecast would suggest that we have an increased risk of drought this year. Six months of warmer and drier weather can certainly do that.
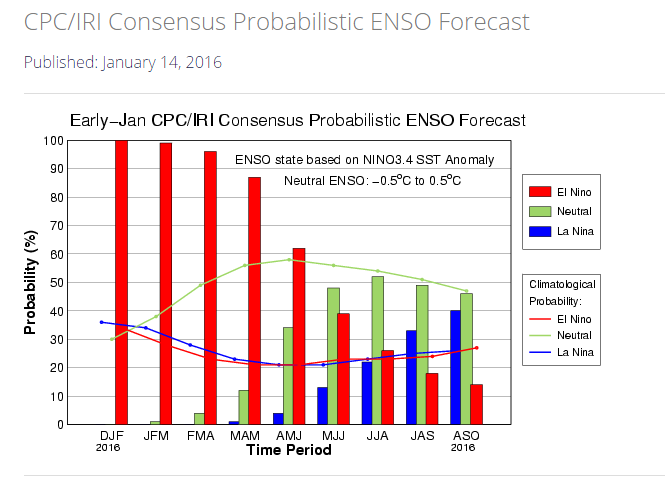
However, the key factors in this forecast will be how the El Niño winds down and if La Niña shows up. The chart below is the forecast showing the odds for how things may play out in 2016. The red bar represents the odds of El Niño. The odds are now at 100% and slowly decreased for the next several 3-month time frames. By May-June-July (MJJ), there is only a 40 percent that El Niño will still be around. At that same time, there is an almost 50 percent chance that we will return to average or “neutral” conditions (green bar).
In the meantime, there is a small, but increasing chance that La Niña could appear (blue bar) and the odds reach 40 percent in August-September-October. Take my word for it, you don’t want La Niña showing up. In Illinois we have a pattern of warmer and drier conditions in the critical July-August time frame during La Niña. A return to neutral conditions is more favorable with near-average conditions in July and August.
Another thing to consider is that El Niño and La Niña are not the only two players in town. Indeed, other weather patterns can overwhelm the influence of these two. For example, we have had several springs in recent years with short periods of a very active storm pattern, resulting in very wet conditions.
What does history tell us?
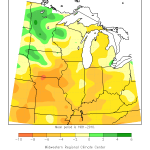
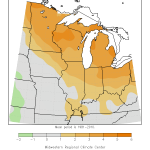
The last two strong El Nino events were 1982-83 and 1997-98.
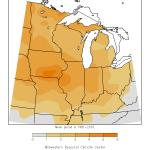
For the 1982-83 event, the spring of 1983 was both cooler and wetter than average. This was followed by a summer that was warmer and drier than average. See maps below.
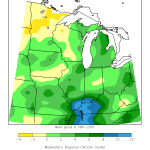
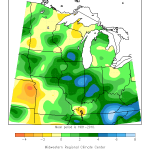
On the other hand, the spring of 1998 was both warmer and wetter than average. This was followed by a summer with near-average temperatures and above-average rainfall. See maps below. Therefore, historically, there is no consistent pattern for the spring and summer after the last two strong El Niño events.
Still concerned about the warmer and drier forecast?
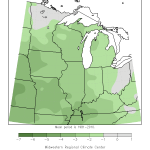
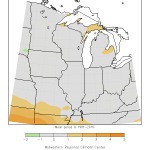
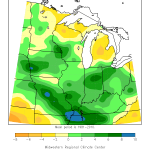
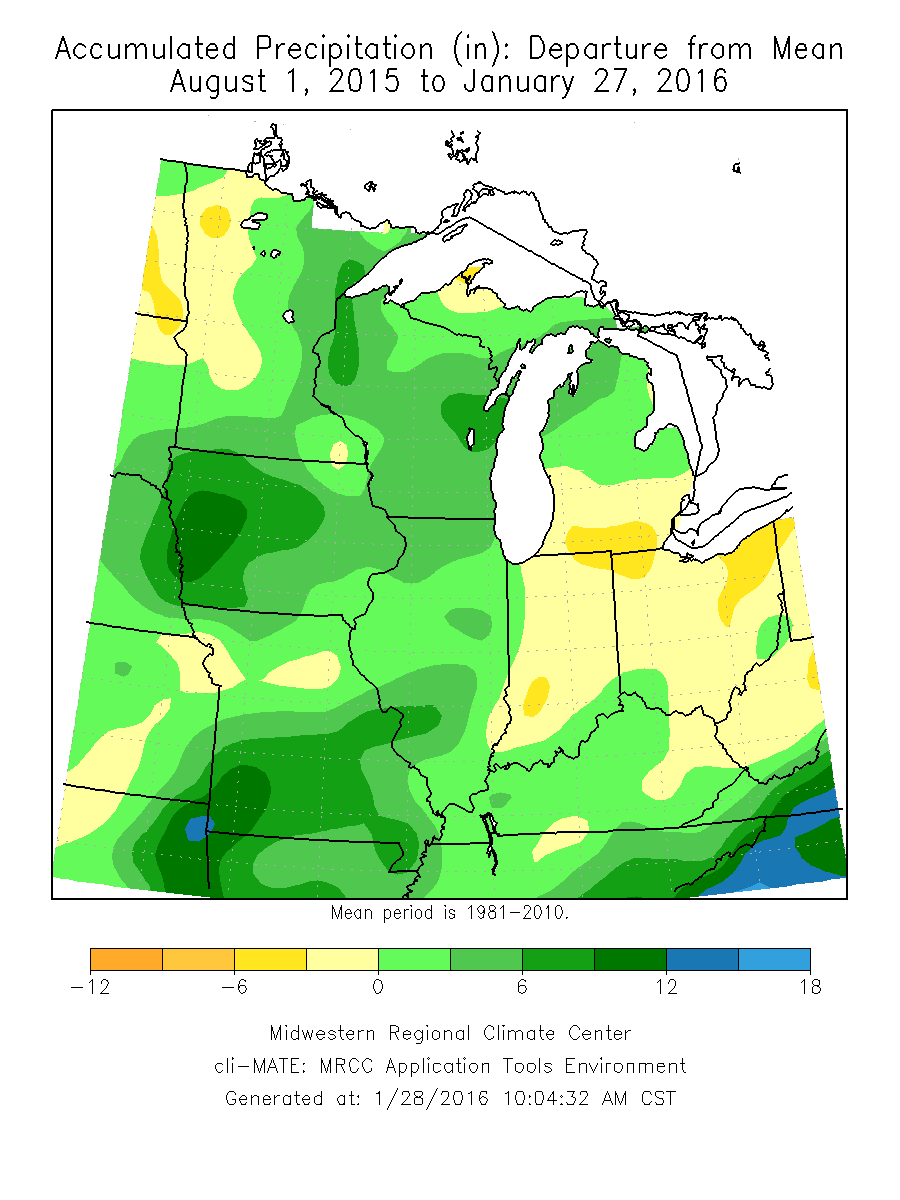
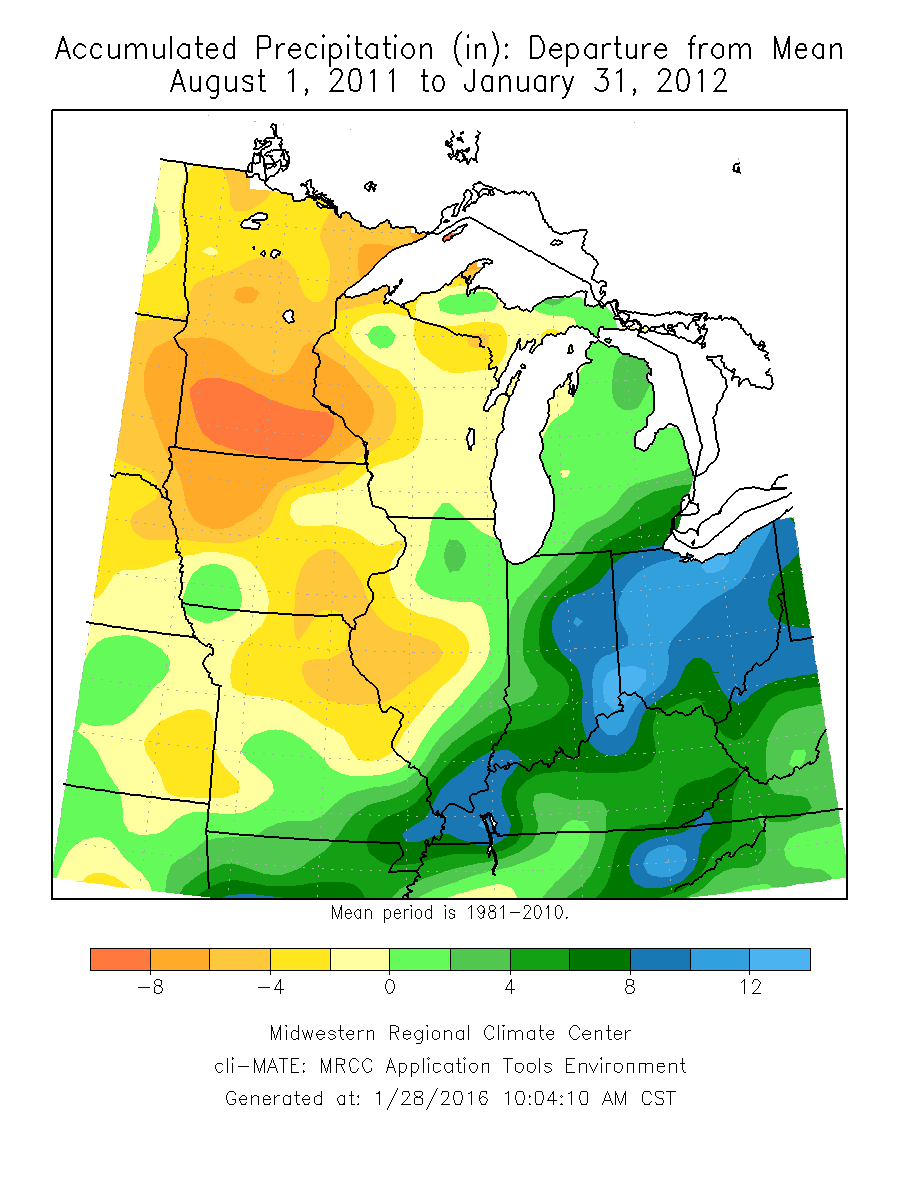
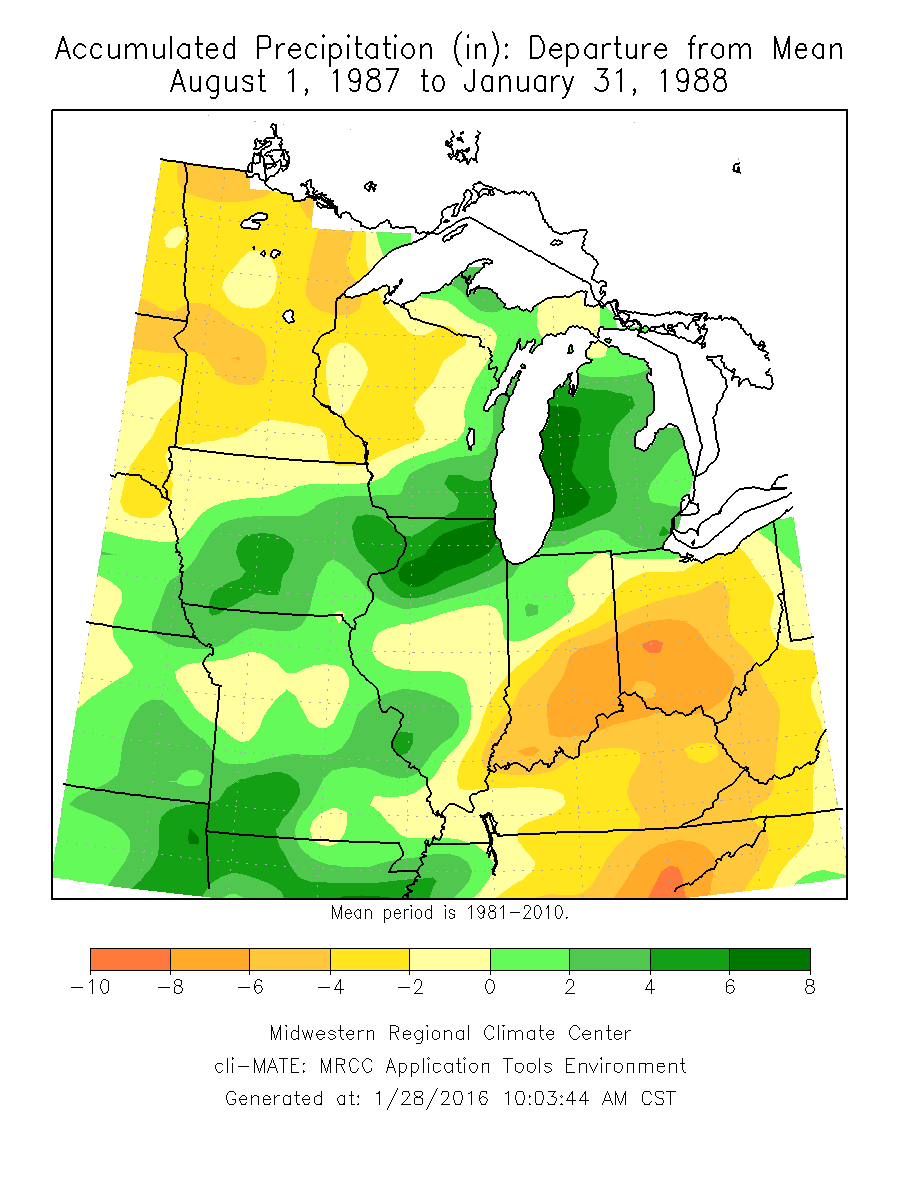
Let’s say for a moment that the forecast becomes true and the next 6 months are warmer and drier than average. The good news is that Illinois has experienced above-average precipitation over the last 6 months. That means that soil moisture is fully recharged around the state, and rivers, streams, and lakes are running high. By this point in the 1988 and 2012 drought, some parts of Illinois were already experiencing long-term dryness. See maps below.
For Illinois, spring is the key for severe agricultural droughts. Average to above-average rainfall in spring provides protection from summer drought through ample soil moisture reserves. However, below-average rainfall in spring can drain those soil moisture reserves early, leading to increased risks of crop damage if the summer turns dry.
If we start running on the warm and dry side over the next 3-4 months as the models are predicting, then I would be more concerned about drought this summer. In the meantime, the Water Survey will be monitoring the precipitation, soil moisture, groundwater, lake levels, and stream flows around the state. You can see our monthly reports at this location.
One Reply to “What is the Risk of Drought for 2016 in Illinois”