The National Centers for Environmental Information (NCEI) reported that the US experienced the second warmest and third wettest year on record, based on records going back to 1895.
Temperature
What is amazing to me is that all of the lower 48 states were warmer than average. From the report …
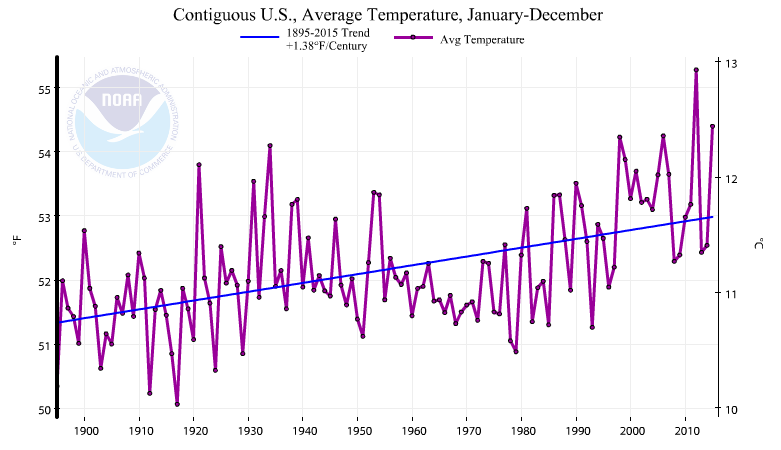
The 2015 annual average U.S. temperature was 54.4°F, 2.4°F above the 20th century average, the second warmest year on record. Only 2012 was warmer for the U.S. with an average temperature of 55.3°F.
Here is what US temperatures look like over time. While the linear trend is 1.4 degrees over the last century, the pattern is more complex with much cooler temperatures in the early 20th century, followed by warming in the 30s and 40s, before cooling slightly in the 60s and 70s, and then warming since the 1980s.
Precipitation
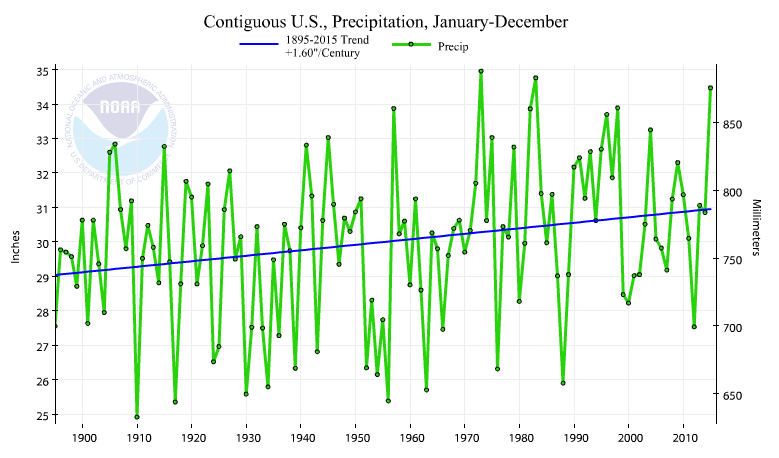
The average contiguous U.S. precipitation was 34.47 inches, 4.53 inches above average, and ranked as the third wettest year in the 121-year period of record. Only 1973 and 1983 were wetter. The central and southeastern U.S. was much wetter than average, while parts of the West and Northeast were drier than average.
Here are the state rankings across the US for 2015. A large portion of the US had above-average precipitation. Both Texas and Oklahoma experienced their wettest year on record. Several states in the Midwest, including Illinois, had one of their top-ten wettest years on record.
Here is the change in US precipitation over time. There is a slow progression towards wetter conditions. In addition, years with less than 27 inches of precipitation were very common before 1965 (12 times) and have occurred only twice since then.