Latest Seasonal Outlook for IL

Illinois has higher odds of being both warmer and drier than average though June, according to the newly released NWS Climate Prediction Center outlooks.

The main driver of the forecast continues to be the strong El Niño event in the Pacific Ocean. El Niño is expected to go away by late spring or early summer. The increased odds of drier conditions through June could be a concern. However, I am more confident in the temperature forecasts from CPC than I am of the precipitation forecasts.

January:

(click on any map to make it bigger)
Illinois has higher odds of being both warmer and drier than average.

January – March:

Illinois has higher odds of being both warmer and drier than average.

April – June:

Continue reading “Latest Seasonal Outlook for IL”

Chance of a White Christmas in Illinois

I just heard “Let It Snow” on the radio and it reminded me that it’s time to do the annual post on …

What are the historical chances of a White Christmas?

We define a “white Christmas” as having at least an inch of snow on the ground on December 25. The map below shows the odds across the state. It should come as no surprise that the highest odds are in northern Illinois.  In general, the odds are about 40-60 percent in the northern third of Illinois, 20-40 percent in central Illinois, and 0-20 percent in southern Illinois.

There can be large differences between nearby sites. Snowfall is notoriously difficult to measure with blowing, drifting, and melting. Two nearby sites may have different results due to exposure to the sun and the wind as well as the dedication of the observer to report on Christmas Day.

WC_Chance_8110

What happened last year?

We had just a little bit of snow on the ground in parts of the northern half of Illinois on December 25, 2014 – hardly impressive. dec25-2014

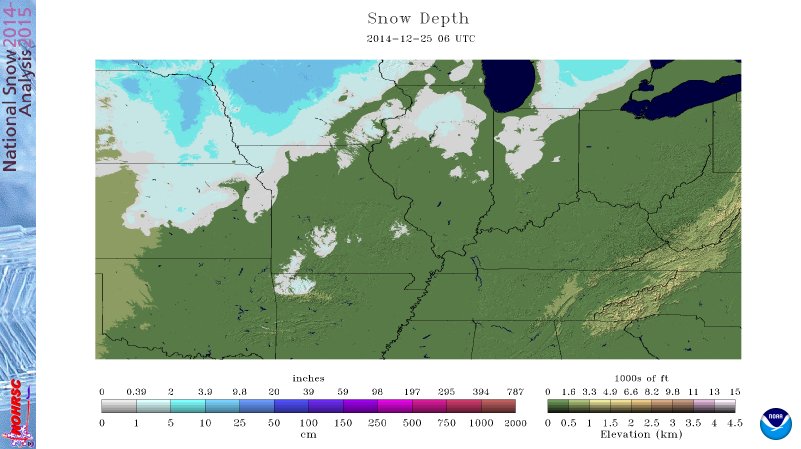
What is the most snow on Christmas Day?

Here are the largest snow depths on Christmas Day (12/25) for selected locations around the state:

  • Chicago, 17 inches in 1951
  • Rockford, 14 inches in 1951 and 2000
  • Quad Cities, 12 inches in 1909
  • Peoria, 10 inches in 1909
  • Springfield, 10 inches in 1915
  • Champaign-Urbana, 9 inches in 1983
  • Carbondale, 9 inches in 2004

What are the odds this year?

What are the odds this year? They may be a little better than you think. While December has been incredibly mild so far, 10 degrees above average, that could change for short periods of time. Keep an eye out for developing storms as we get into Christmas week.

[An earlier version of this post had an interesting run from the GFS model showing a potential for snow around Christmas, but subsequent model runs did not support this. ]

Fifth Warmest Fall in Illinois

The average temperature for fall in Illinois (September-November) was 57.4 degrees, 3.0 degrees above average. As a result, it is the 5th warmest fall since 1895, based on preliminary data.

The top five warmest falls in Illinois:

  1. 1931 with 59.8 degrees
  2. 1963 with 58.0 degrees
  3. 1998 with 57.7 degrees
  4. 1971 with 57.5 degrees
  5. 2015 with 57.4 degrees

Here are the monthly departures of temperature in Illinois through the end of November for 2015. All three fall months were warmer than average. September was 4.6 degrees above average, October was 1.7 degrees above average, and November was 4.5 degrees above average.

image019.png

Monthly precipitation for 2015 shows the near-average September, the dry October, and the wet November. The 3-month total was 10.44 inches, 0.5 inches above average. Of course, this was overshadowed by the wet spring, especially June. In face, Illinois has already reached 41.79 inches of precipitation in 2015, 1.35 inches above the 12-month average.

image021.png

Warm, Wet November in Illinois

Summary: Illinois just finished its third wettest and tenth warmest November on record. Even with the warmer conditions, significant snowfall fell across the northern half of the state over the weekend before Thanksgiving.

Precipitation

The statewide precipitation total was 5.60 inches, 2.13 inches above average and the third wettest November on record. In first place was 1985 with 9.05 inches, and in second place was 1992 with 6.51 inches. I remember November 1985 quite well – it was overcast every day and dreary the entire month.

The largest reported precipitation total for November was Rock Island Lock and Dam with 8.39 inches. This was followed closely by Sparta (IL-RH-8) with 8.09 inches. Precipitation includes both rainfall and the water content of snowfall.

Here is the map of total precipitation for November. Areas in yellow and orange received 6 to 9 inches of precipitation. Areas in the shades of green were not quite as wet but received between 3 and 6 inches of precipitation.

IL-prcp-mpe-m2d-tot

Continue reading “Warm, Wet November in Illinois”