
I have received several calls already about the shortage of pumpkins in Illinois. This pertains not only to the decorative ones seen everywhere, but especially for the processed varieties grown around Morton Illinois. Time Magazine had a short article saying that 90% of the processed pumpkin production comes from Illinois and that they expect a one-third drop in production this year. Here is an excellent article describing pumpkin production in Illinois.
What Happened?
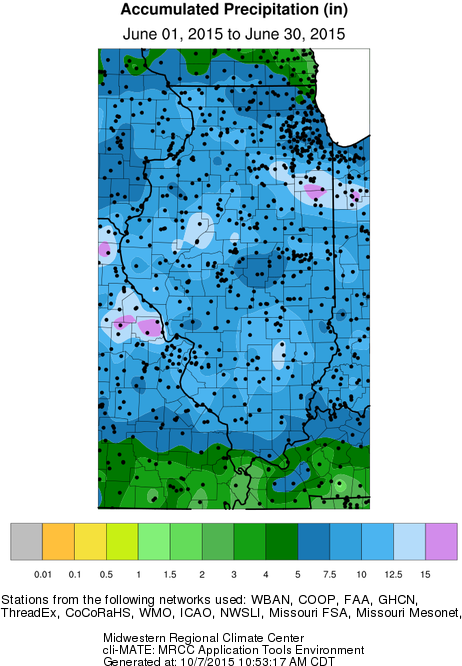
The primary cause of the current shortage is the record-setting precipitation in June. It didn’t help that May and July were wetter than average as well. Statewide, the average precipitation in June was 9.43 inches, 5.33 inches above average and the wettest June on record. In the map below, amounts of 5 to 10 inches (shades of blue) were common across the state.
A closer examination of the records in Morton, IL, show how severe the situation was this spring and early summer.
- May: 5.9 inches of precipitation, 0.9 inches above average;
- June, 11.1 inches, 7.2 inches above average;
- July, 6.2 inches, 2.3 inches above average.
That was a grand total of 23.2 inches (or almost two feet) of precipitation in three months, 10.4 inches above average, and just about double the average precipitation.
August and September were warmer and drier. But it looks like it was too little, too late.
2009 Growing Season
Now if this story sounds familiar, it is. We had a similar situation in 2009 with a wet spring, followed by a record cool July, and a very cold and wet fall that greatly hindered the harvest of pumpkins (as well as corn and soybeans) that year.
Trends in Precipitation
Overall, if you look at the past century in Illinois, our precipitation has increased by about 10 to 15 percent, depending on the location. If we zoom in on central Illinois and look exclusively at the May-July period, precipitation has increased by about 2 inches over the last century. Obviously, some years will buck the trend like the droughts in 1988, 2005, and 2012.
An interesting side note, check out the difference between 1988 and 1990. In the course of two years, the May-July precipitation went from a dismal 3 inches in 1988 to 20.6 inches in 1990.
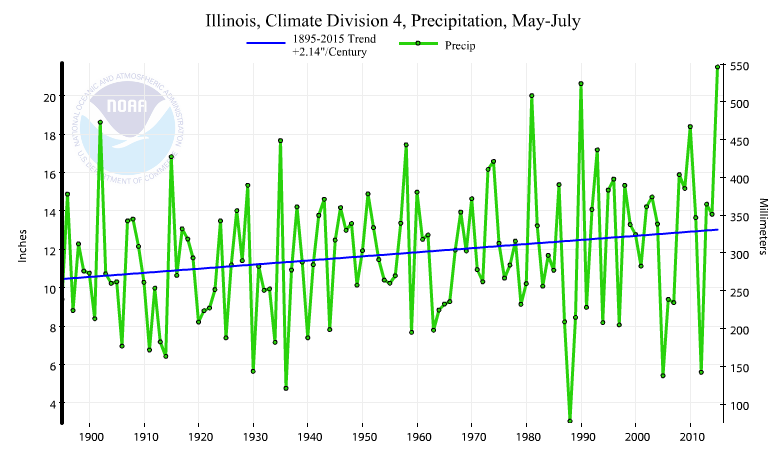
You likely noticed from the graph that in the same time period 1 to 2 years following an exceedingly wet May-July, the precipitation falls to normal or far below normal for those months. At this time with the strong El Nino underway, this looks to possibly be the same outcome yet again for May-July 2016. Weather/climate goes in cycles, and it seems it will prove it yet again. If we’re short on moisture this spring/early summer, you might want to reference this graph in a post again at that time.
That’s one of the hallmarks of Illinois climate – a lot of year to year variability. I sometimes say in talks that one viable forecast for next year is to pick the exact opposite of this year.