

August was cool across the state and dry in most places in Illinois, capping off a summer that was cool and wet.
Precipitation
The statewide average precipitation for August in Illinois was 2.95 inches, 0.64 inches below average. However, this was followed by a very wet June with 9.44 inches, and a wet July with 4.84 inches. As a result, the summer precipitation total was 17.23 inches. That was 5.36 inches above average and the 6th wettest summer on record.
Here are the top ten wettest summer in Illinois. It was wetter than last summer and 2010, but nearly an inch away from the incredible summer of 1993.
| Rank | Year | Total | Departure | % of Average |
| 1 | 1993 | 18.51 | 6.64 | 156 |
| 2 | 1902 | 18.14 | 6.27 | 153 |
| 3 | 1981 | 17.62 | 5.75 | 148 |
| 4 | 1915 | 17.58 | 5.71 | 148 |
| 5 | 1958 | 17.53 | 5.66 | 148 |
| 6 | 2015 | 17.23 | 5.36 | 144 |
| 7 | 2010 | 16.24 | 4.37 | 137 |
| 8 | 1907 | 15.78 | 3.91 | 133 |
| 9 | 2000 | 15.26 | 3.39 | 129 |
| 10 | 2014 | 15.25 | 3.38 | 128 |
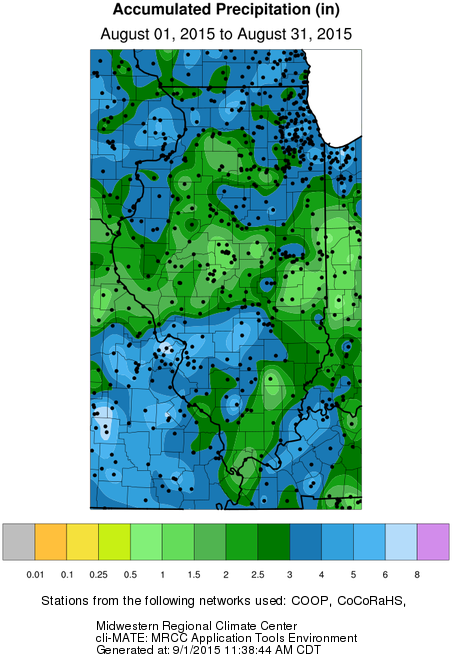
The precipitation for August was unevenly distributed, which is typical in the summer months. Amounts of 3 to 5 inches were common in northern Illinois and points east of St. Louis.
Here are the precipitation departures from average for August. Most of the state was at or slightly below average. A few small spots in northern Illinois, and areas east of St. Louis were above average.
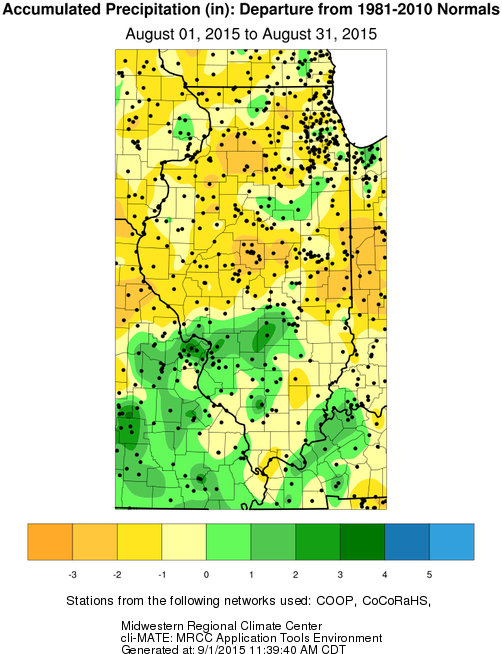
By the way, this is a new map series produced by the Midwestern Regional Climate Center based on station data with the dots representing actual reports. We could not do this without the help of the NWS COOP and CoCoRaHS volunteer networks.
Temperature
The statewide average temperature for Illinois in August was 72.0 degrees, 1.6 degrees below average at the 32nd coolest August on record. The statewide average temperature for the summer (June, July, and August) was 72.6 degrees, 1.3 degrees below average and the 36th coolest on record.