Temperature Departures in Illinois During the 1982-83 and 1997-98 El Nino

The bar graph below summarizes the monthly temperature pattern for the past two strong El Niño events in Illinois – the 1982-83 event and 1997-98 event. The warmer than average winters stand out while the results for fall and spring are mixed.

image001
Click to enlarge.

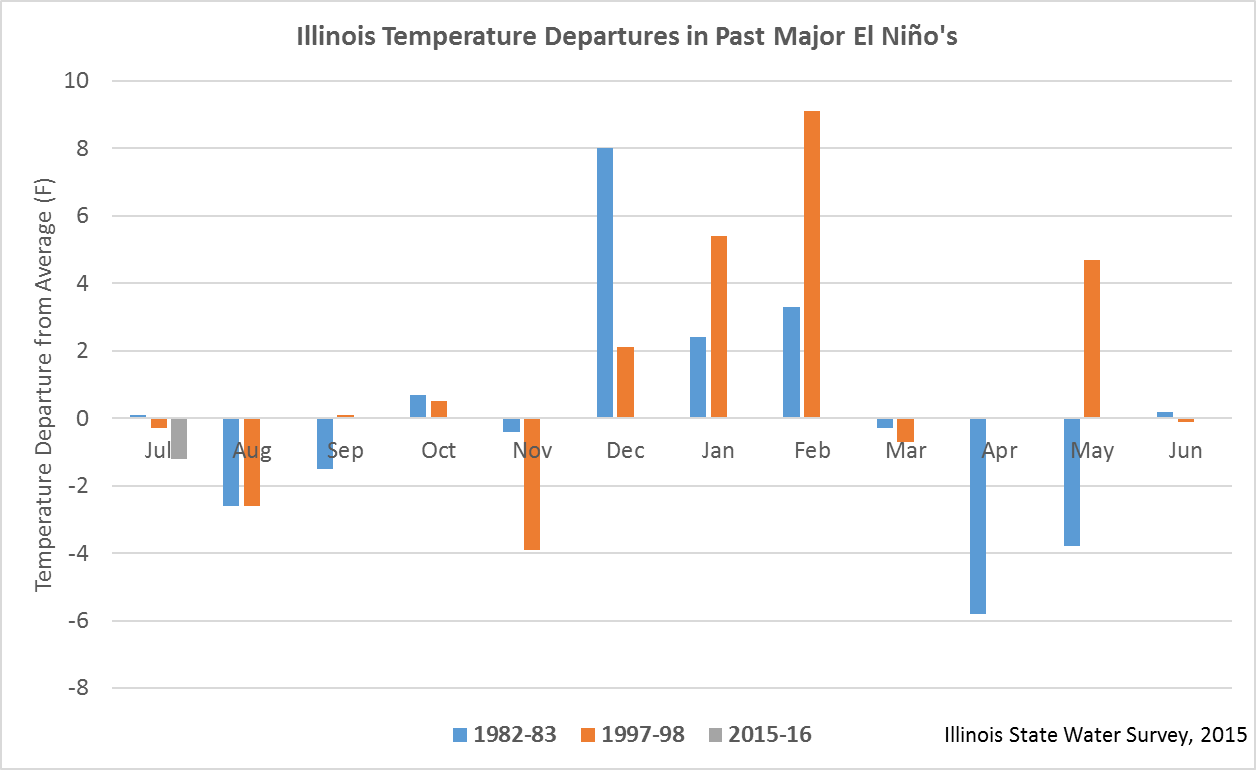
In the fall as El Niño starts to develop, both of the earlier events tended to be a little cool at times, but not in a consistent way. Overall, the 1997-98 event was cooler thanks to the exceptionally cold November.

By December warmer than average temperatures were associated with El Niño, a classic pattern for stronger events. However, if you look closely, the nature of the warming differed between the two. The 1982-83 event had its warmest departures in December and less so in January and February. On the other hand, the 1997-98 event clearly ramped up with relatively cold temperatures in November, and each following month showing stronger above-average temperature departures through February.

By spring, the story gets complicated. By March, the influence had disappeared. April was colder than average for the 1982-83 event while near-average for the 1997-98 event. For May, Illinois temperatures were colder than average for the 1982-83 event and warmer than average for the 1997-98 event. That is hardly a consistent pattern.

Cool, Dry Week in Illinois

What a pleasant week in Illinois. Temperatures were about 8 degrees below average and very little rain fell over the last 7 days as of Friday morning, except for a few spots in southwestern Illinois (map below). The NWS forecast show that temperatures will be warming this weekend and next week. There is a chance of rain on Saturday, but Sunday and the rest of next week looks hot and dry.

friday

Last Two Big El Nino Events – Milder Winters in Illinois

The latest NWS forecast for the winter months of December-February has Illinois with an increased chance of above-average temperatures. In general, the core winter months of December, January, and February, were much warmer in Illinois and the Midwest during the last two major events in 1997-98 and 1982-83.

Along with the warmer temperatures was a noticeable drop in snowfall across most of Illinois during the core winter months. Some places in eastern and southern Illinois saw their snowfall totals cut in half. However, while the overall pattern was for less snowfall, it still snowed. And some places saw significant snowfall events in November and March, outside the core winter months.

Precipitation (rainfall + water content of snow) was closer to average and in some places, such as western and northern Illinois, wetter than average. This suggests that many of the snowfall events were replaced by rain events under the much warmer conditions.

1997-98 El Niño

The 1997-98 El Niño event saw much above average winter temperatures across Illinois and the Midwest. For Illinois, it was the 3rd warmest December-February on record at 34.6 degrees, and 5.6 degrees above average.

Click to enlarge.
1997-98 temperature departures. Click to enlarge.

Continue reading “Last Two Big El Nino Events – Milder Winters in Illinois”

Another Forecast Suggests a Higher Chance of a Wet Fall in Illinois

Last week, the NWS Climate Prediction Center released their official forecast for fall and winter. Their forecasters used a variety of tools and as well their own expertise to develop those forecasts. While their forecast for Illinois this winter was interesting, the one for fall was not.  They had us with equal chances of above-, below-, and near-average temperature and precipitation.

However, there is one forecast tool that showed some results for Illinois this fall. That tool is called the North American Multi-Model Ensemble (NMME). It consist of several forecast models that are run out to 7 months. The advantages of having multiple model runs are that an average of all results tends to be a better forecast than a single model. Also, the spread in the model results gives you an idea of the uncertainty of the forecast. For example, if all the models showed this winter being warmer-than-average, our confidence in the forecast would be much how than if some models showed it being warmer, some models showing colder, and others showing average conditions.

These results below for fall (SON=September, October, November) are considered experimental and not part of the NWS official forecast. However, they do shed some insight on what the models are “thinking” for fall. The first map show the chances on fall precipitation in three categories (wet, dry, average) using all models. They have Illinois and much of the US with an increased chance of above-average precipitation.

prob_ensemble_prate_us_season1

Continue reading “Another Forecast Suggests a Higher Chance of a Wet Fall in Illinois”