Agricultural Impact of the Wet Growing Season in Illinois

Here is the precipitation across Illinois for past 90 days as a percent of average. Click to enlarge.

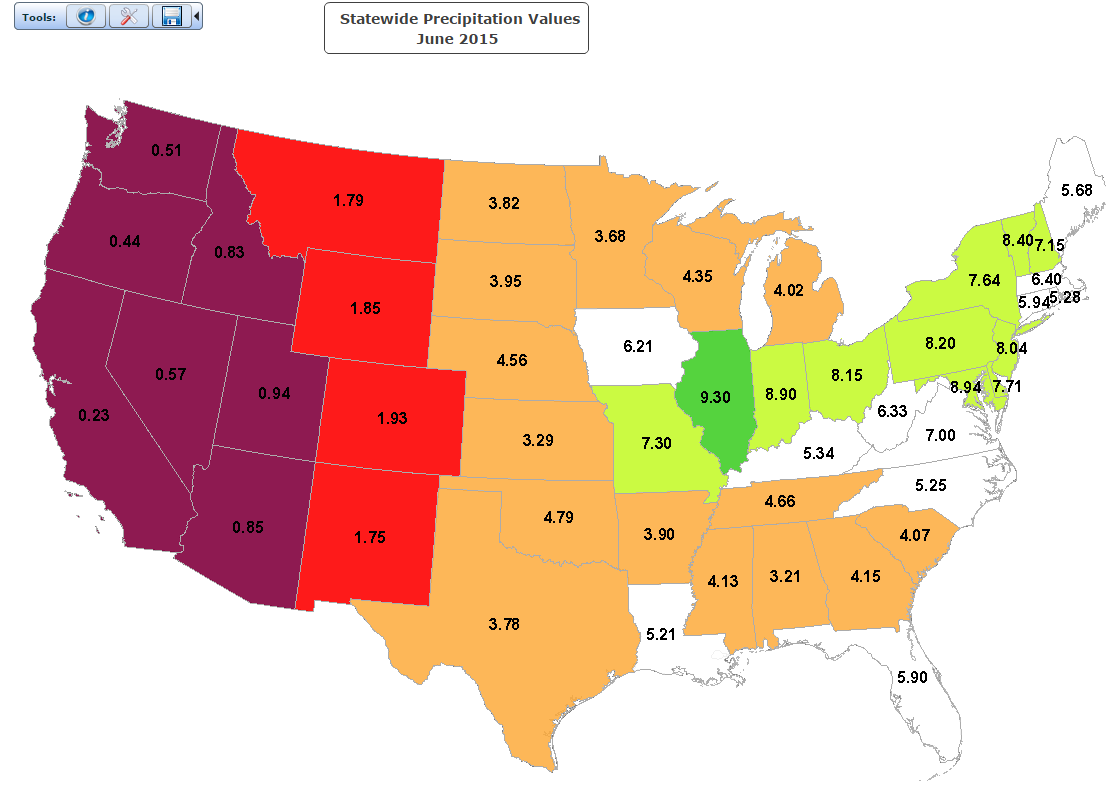
After a record-setting June, as well as a wet May beforehand and a wet July so far, we are seeing the agricultural impacts of the wet growing season. Right now, the state-wide July precipitation in Illinois is at 3.1 inches. That is about 50% above the long-term average for this time in the month.

According to the USDA report yesterday, only 96% of the soybean crop in Illinois has been planted.

Meanwhile, the corn and soybeans already in the ground have struggled. For corn, 5% of the crop was rated “very poor” and another 11% rated “poor”. For soybeans, 7% of the crop was rated “very poor” and another 13% rated “poor”.

According to the National Weather Service, the potential for heavy rainfall remains – especially in northern Illinois. Rainfall amounts over the next 7 days could range between 1 to 3 inches in northern Illinois, 0.25 to 1 inch in central Illinois, and 0.25 inches or less in southern Illinois. Local amounts could vary widely from place to place due to the nature of the storms.

p168i
Click to enlarge.

2015 Versus 1993 in the Midwest

I have had several people say that all this summer feels like 1993. If you compare 2015 with 1993 in the maps below for June 1 – July 13, you can see that in 2015 the heavy rains were more concentrated in Missouri, Illinois and Indiana (shades of light blue and pink, indicating between 12.5 and 20 inches of rain). In fact, Illinois has been wetter in 2015 than in 1993 during the last 6 weeks.

The rains of 2015 have lead to moderate to major flooding on the Illinois River, as well as moderate flooding on the Mississippi River from Quincy southward according to the National Weather Service.

On the other hand, in 1993 the heaviest rains were shifted northward and westward (second map) and Missouri and Iowa took the brunt of the heavy rains. That northward and westward shift in the heavy rains resulted in major flooding impacts on the Missouri and Mississippi Rivers.  Continue reading “2015 Versus 1993 in the Midwest”

Illinois Was the Wettest State in the US in June

The National Centers for Environmental Information (formerly NCDC) released their numbers for June, showing that Illinois did indeed have its wettest June on record with 9.30 inches (according to their calculations). That made Illinois the wettest state** in the US for the month.

Here are the national maps showing the statewide precipitation values for June 2015. While Illinois received 9.3 inches of precipitation, California received only 0.23 inches – an amount 40 times less than Illinois.

figure2
Click to enlarge. Source National Centers for Environmental Information.

Continue reading “Illinois Was the Wettest State in the US in June”

NWS Outlook for July – Cooler and Wetter in Illinois

Illinois has an increased chance of below-average temperatures and above-average precipitation in July, according to the outlook released by the NWS Climate Prediction Center earlier this week.

The July precipitation forecast is amazing for showing such a large area with an increased chance of above-average precipitation. The odds are especially high in southern Illinois. This does not necessarily mean that July will be record-breaking like June, just wetter than average.

off15_prcp
Precipitation forecast for July. Click to enlarge.

The July temperature forecast shows a large area across the central US with an increased chance of below-average temperatures. Historically, it is not unusual in Illinois for wet conditions in May and June to lead to cooler temperatures in July. The wet soils keeps the air temperatures cooler. At least that’s the theory.

off15_temp
Temperature forecast for July. Click to enlarge.