Despite cool weather at times, May was 2.3 degrees above average on temperature and one inch above average on rainfall with 5.6 inches.
The statewide average rainfall was 5.6 inches, which was 1 inch above average and the 22nd wettest May on record. Some of the heaviest amounts were seen in northwest Illinois and just southeast of St. Louis (orange and red areas on the map). The highest reported monthly rainfall total was 9.41 inches at Red Bud (Randolph County). The next highest total was 8.77 inches at Mt. Carroll.

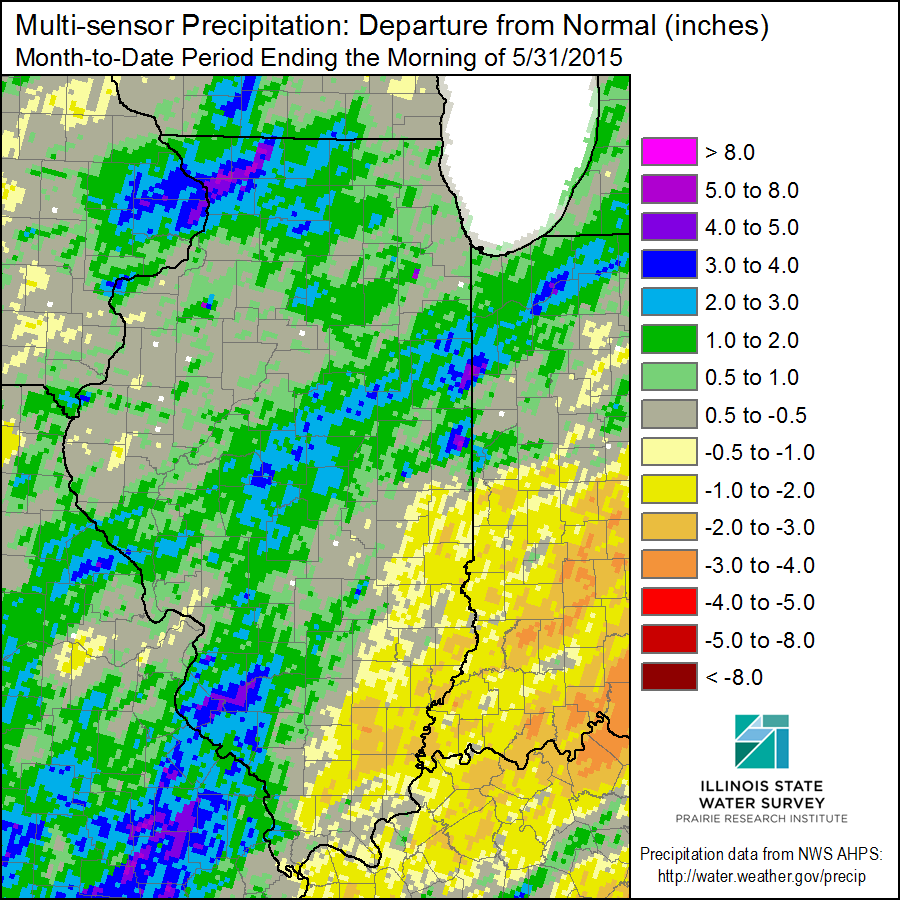
For May, the rainfall departures from average map below shows that most of Illinois was near-average (grey) to above-average (green and blue). There was a stretch of Illinois to the east of Interstate 57 from near Champaign southward with below-average rainfall for the month.