October Wetter Than Average for Illinois

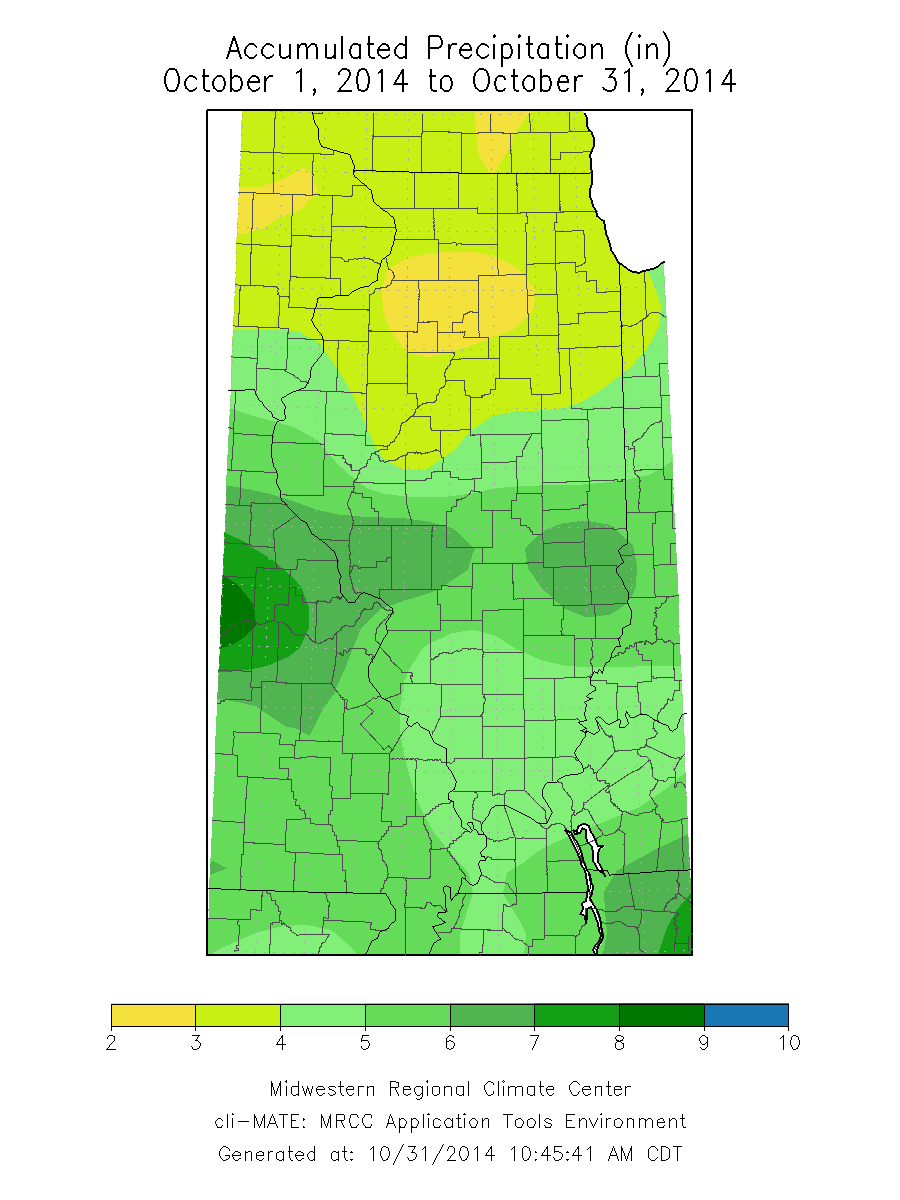
Based on preliminary numbers*, the statewide average precipitation for October in Illinois was 4.5 inches, which is 1.2 inches above average. It was the 15th wettest October since 1895. The wettest October on record for the state was 1941 with 9.06 inches of precipitation.

The largest precipitation totals were in the central third of the state where 6 to 8 inches were common. Greenfield had an incredible 9.94 inches of precipitation. Medora, Girard, and Carlinville also reported over 9 inches of precipitation. Precipitation totals were more moderate elsewhere; 4 to 6 inches in southern Illinois and 2 to 4 inches in northern Illinois. Also, several locations in northeast Illinois reported seeing traces of snow for the month.

The statewide average temperature was 54.0 degrees, 0.1 degrees below average.

*I updated these numbers on November 2 with only a 0.2 degree change in temperature from 54.2 to 54.0 degrees.

MAPS AND PLOTS FOR OCTOBER

map1

map2

The plot of past October precipitation for Illinois (below) shows that things have become slightly wetter over time, about 0.64 inches in the last century. The outstanding October’s of 1941 and 2009 are easily seen as well.

plot1

Chance of a Repeat of Last Winter

Probably the most frequently asked question I get these days is “Will this winter be as bad as last winter?” I discussed this a bit in an earlier post. The National Weather Service forecast does not show a repeat of last winter based in part on winter trends and the possible arrival of El Niño.

Another way to look at this is through the historical data. I looked at the 20 coldest winters for Illinois since 1895 and what the next winter was like (table below). “Temp” is short for temperature and “depart” is short for temperature departure from average.

Since this last winter was #9, that leaves us with 19 other winters where we can look at the next year. Of those 10 of the following winters were below average. In fact, we see the three-peat winters of 1976-77, 1977-78, and 1978-79 in the line up as well as the repeat winters of 1903-04, and 1904-05.

Or if you are an optimist, 9 of the following winters were at or above average. If you look at the plot below the table, you can see that with the exception of the late 1970s and the early 1900 episodes, our colder winters have been followed by a winter more moderate – maybe not warm but at least not as cold. Also we have seen a warming trend of about 1ºF in the historical record. For the record, I’m hoping for a milder winter.

Top 20 coldest winters (December-February) and the following winters.
Rank Winter Depart Next Winter Depart
1 1977-78 -9.5 1978-79 -9.3
2 1978-79 -9.3 1979-80 -1.4
3 1935-36 -9.0 1936-37 +0.1
4 1917-18 -8.8 1918-19 +3.7
5 1976-77 -8.3 1977-78 -9.5
6 1903-04 -7.9 1904-05 -7.4
7 1962-63 -7.6 1963-64 -3.2
8 1904-05 -7.6 1905-06 +0.4
9 2013-14 -7.4 2014-15   ??
10 1911-12 -6.3 1912-13   0
11 1981-82 -6.2 1982-83 +4.6
12 1898-99 -6.1 1899-00 -2.5
13 1901-02 -6.0 1902-03 -2.9
14 1909-10 -5.7 1910-11 +0.1
15 1919-20 -5.3 1920-21 +3.9
16 1969-70 -4.7 1970-71 -1.3
17 1958-59 -4.4 1959-60 +1.0
18 1928-29 -4.3 1929-30 -0.1
19 2000-01 -4.3 2001-02 +5.6
20 1983-84 -3.9 1984-85 -2.9
Statewide average winter temperature for Illinois. Source: National Climatic Data Center.

Illinois and US Tornado Statistics for 2014 So Far

Illinois Tornado Statistics

So far, we have had 30 tornado reports in Illinois for 2014*, according to initial reports from the NOAA Storm Prediction Center. Nearly half of those were from the tornado outbreak of February 20th. Our five-year average is 59.

*Of course, 2013 was a quiet year until the November 17th outbreak that struck Illinois.

Normally, our core tornado season is March-June with about two-thirds of our tornadoes occurring then. This year was very quite during that period, I think in part due to the colder spring weather. Here is the tornado count by month:

  • January: 0
  • February: 14
  • March: 0
  • April: 4
  • May: 2
  • June: 2
  • July: 0
  • August: 0
  • September: 0
  • October: 7

Here are the event reports from the National Climatic Data Center through the end of July. This database contains some edits to the initial data from the Storm Prediction Center so the totals may not line up between the two sources. You can recreate this report with working links to each event at: http://www.ncdc.noaa.gov/stormevents/

Storm Events NCDC

US Tornado Statistics

Here is the distribution of the tornadoes for 2014 and the graph of accumulated tornado totals by year for the past 10 years, according to the NOAA Storm Prediction Center. Right now the national count is 998 tornadoes, which is below the ~1300 average through this date. The number of tornado-related deaths this year is 45, compared to 55 in 2013 and 70 in 2012.

2014_annual_map_torn
Initial reports of tornadoes in Illinois and across the US for the period of January 1 to October 27, 2014. Source: NOAA Storm Prediction Center.
torngraph-big
Here are the accumulated annual tornado totals for the past 10 years for the US. Right now we are at 998 tornadoes through October 27 (black line on graph). That puts us below average and on track with 2005 and 2012. Interestingly, those two years saw drought problems in the Midwest and the Plains states. Source: NOAA Storm Prediction Center.