I will admit it – ever since I was a kid I have been fascinated/obsessed with maps. It is probably why I ended up in a career in climatology since we use maps all the time.
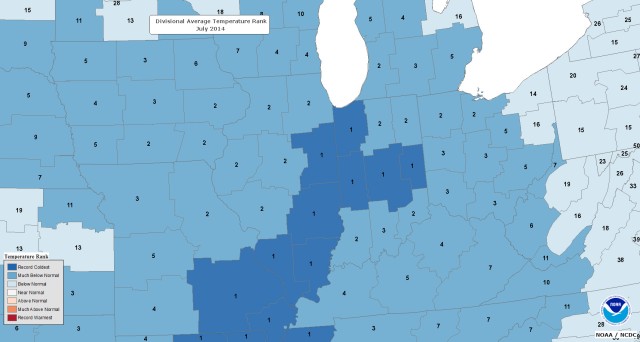
Here are maps from the National Climatic Data Center showing how cool July was across the Midwest. The regions are called “climate divisions” and there are nine of them in Illinois. The ones in the darkest blue had their coolest July on record, with records going back to 1895. Click on the map for a larger version which shows the numbers more clearly.
You can read more about what happened in the US in July.

And here are the temperature departures from the 1981-2010 average.

Here is the US map for July, showing that while the Midwest was cool, the western US was experiencing record warmth.

This temperature pattern across the United States is the result of a ridge of high pressure over the western US and a trough of low pressure over the central US throughout most of July.


