Friday Roundup in Illinois

It is no surprise that June has turned into a wetter-than-average month. The statewide precipitation in Illinois is sitting at 6.1 inches, 1.9 inches above average. Several locations in central and northern Illinois have reported rainfall totals in the 8 to 10 inch range. Two of the highest so far are Dixon (IL-LE-17) with 10.15 inches and Galena (IL-JD-2) with 10.12 inches. We will have the final statistics on June next week.

As the map below shows, areas in green and blue are in the 5 to 12 inch range, and are common across central and northern Illinois, as well as northern Missouri, Iowa, Minnesota, southern Wisconsin, and parts of Indiana.

MonthPDataMRCC

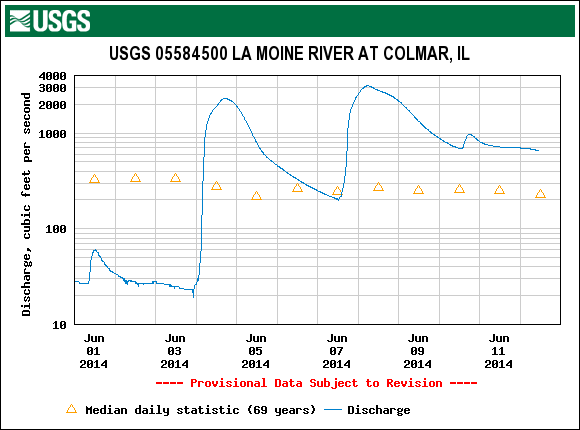
Of course, lots of rain means lots of runoff and flooding. Most of the rivers and streams in Illinois and the Midwest are having relatively high flows, shown by this USGS map. The green dots show flow in the normal range, blue dots indicate above normal flow, and black dots are record flows for this date.

USGS WaterWatch    Streamflow conditions


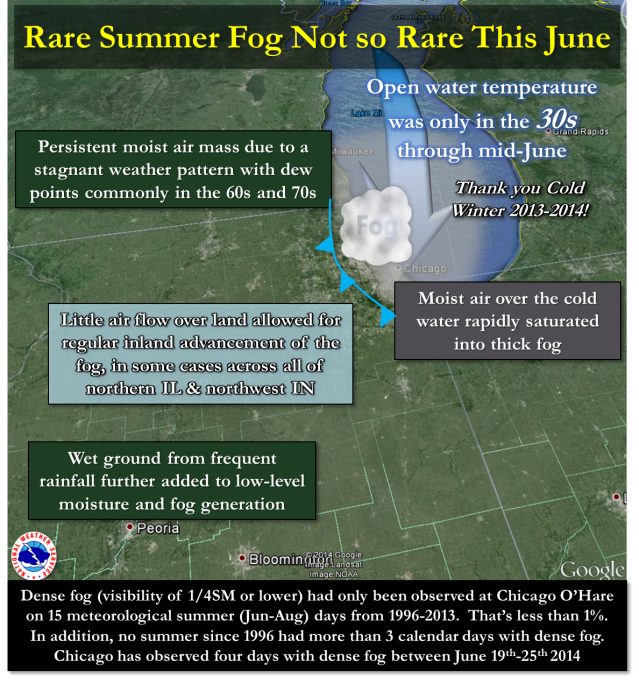
Finally, the Chicago area has not only struggled with heavy rainfall events that have caused flooding in June, but they have had an unusually high number of days with fog. Here is the web page from the Chicago NWS office explaining what is going on with this fog.

densefog
Click to go to original NWS article on the not so rare summer fog.


New Climate Outlook for July and Summer – OK for Illinois

Today (June 19) the NOAA Climate Prediction Center has released their latest outlook for July and the rest of the year. One of the factors to come into play this fall and winter is the developing El Niño event in the Pacific Ocean. Unshaded areas show an equal chance (EC) of above, below, or near-average conditions. Click on any map to enlarge.

JULY

For July, we have EC for both temperature and precipitation in Illinois, except for a slight risk of below-average precipitation in southern Illinois. We are sandwiched between cooler than average conditions in the north and warmer that average conditions in the south.

off14_tempoff14_prcp


JULY-SEPTEMBER

For July through September we have EC for both temperature and precipitation in Illinois. From the standpoint of the Corn Belt, the increased chance of cooler than average temperatures in WI, MN, and the Dakotas through September may spell trouble for getting the corn crop to mature in time this fall. Wetter than average conditions are expected in the central West, which could bring some relief to drought conditions in that region.

off01_tempoff01_prcp


DECEMBER-FEBRUARY

For December through February, the core winter months, Illinois and much of the northern half of the US has an increased chance of above-average temperatures. This forecast reflects the expectation that El Niño will arrive. El Niño tends to bring milder temperatures in winter for Illinois and wetter conditions in the Southwest and Southeast.

off05_tempoff05_prcp

Looking for Weather Data in Illinois and the Midwest – Try Cli-MATE

The Midwestern Regional Climate Center has extensive databases on daily temperature, precipitation, and snowfall across Illinois and the Midwest. This used to be a subscription-based system. In fact, one of my original jobs at the Illinois State Water Survey was working on the original version of this system, then called MICIS. In 2013 they revamped the system and made it free to everyone. All that’s required is a quick registration. The URL is http://mrcc.isws.illinois.edu/CLIMATE/ Check it out!

I use it for almost all my data, mapping, and plotting needs at work. For example, here is a plot for Chicago of daily temperature and precipitation so far in June of this year. This is a screen shot, the live version allows the pop-up window to move with the cursor.

chart


Wet Start to June in Illinois

June rainfall has been well above average for much of Illinois. Rainfall amounts in the 3 to 8 inch range were common in the last 14 days (yellow to red in the map below). The relatively driest part of the state was the northwest corner where amounts were less than 2 inches. Heavy rainfall amounts were reported in Missouri, southern Iowa, and Indiana as well.

fig1

The NWS precipitation forecast for the next 7 days (map below) shows more opportunities for rain, especially in northern Illinois. The 6-10 day and 8-14 day forecast show an increased chance of wetter-than-average conditions for Illinois and the eastern Cornbelt.

p168i

At the beginning of June we had some concerns for western Illinois, especially with low river and stream flows and short to very short subsoil moisture (below 6 inches). The recent rains have improved the situation to some degree. For example, the La Moine River at Collmar IL USGS stream gauge increased from 30 cubic feet per second on June 1 to 3,000 cubic feet per second on June 8, a one-hundred fold increase in flow (figure below).

The last USDA report from June 9 showed widespread improvements in topsoil moisture. In fact, 12 percent of the state reported excess topsoil moisture. I suspect that percentage would be even higher now. However, subsoil moisture in western Illinois improved only slightly, suggesting that much of the rain ran off into the streams and rivers instead of recharging the deeper layers of the soil.

fig2