I was driving back from a meeting yesterday and saw creeks that were bank full and water standing in fields. That’s the first time I’ve seen those sights in a while, maybe over a year ago in this part of Illinois (Champaign County).
In the last 7 days, widespread rainfall amounts of 1 to 3 inches have been reported across the state. See the map below. This is a National Weather Service product that combines high-resolution radar estimates calibrated with rain gauge measurements (see map below). The heaviest rains fell in northern Illinois, an area considered to have been in some stage of drought earlier this week. Because some of the rain fell after the cutoff for this week’s Drought Monitor, I would expect to see the effects of these rains in next week’s map.
Another bit of good news is that the soils appeared to be unfrozen across most of the state during this rain event, thanks to the warm temperatures early in the week. See the second map below from our network of 19 soil temperature sites across Illinois. As a result, much of this rain should have had a chance to soak in and recharge the soil moisture profile.
Finally, the abundant and widespread rainfall across the state has increased the flow in streams and rivers across the state. Many stream gauges report levels that are in the upper 90th percentile for this time of year. In fact, the National Weather Service has reported some minor flooding along the Kaskaskia and Little Wabash Rivers. The result is that much more water is flowing into the critically low Mississippi River. The Mississippi River stage at Chester Illinois (below St. Louis) has risen seven feet and is expected to rise another four feet in the next day or two (last figure).
While the recent rains should provide some temporary relief for barge traffic on the Mississippi River, levels are expected to start dropping again in a few days. The larger problem is that about 80 percent of the Missouri River and Upper Mississippi River basins are in some stage of drought, according to the U.S. Drought Monitor. Until those two basins are in better shape, concerns with Mississippi River flows will remain for some time.


Latest Monthly and Seasonal Outlook Released
Yesterday NOAA’s Climate Prediction Center released their outlooks for February and beyond (see maps below). For February they call for an increased chance of below-average temperatures for the upper Midwest, including the northern two-thirds of Illinois. Precipitation in Illinois is expected to have equal chances (E.C.) of being above, below, or near average.
For February through April, temperatures have an equal chance of being above, below, or near average. It’s what I call a neutral forecast. On the other hand, there is an increased chance of above-average precipitation across the Great Lakes region, including the northern three-fourths of Illinois. That would be great news for the further recovery of drought conditions in Illinois, if it pans out.
The outlook for May through July indicates that a large part of the US is expected to have an increased chance of above-average temperatures (last map). The precipitation outlook for this period is neutral.
The outlook for August through October (not shown) is not very interesting for Illinois with equal chances of above, below, and near average temperature and precipitation. In other words, it is a very neutral outlook.
As of January 18, this month has been warm and wet. Temperatures have been almost 5 degrees above the long-term average. Precipitation, mostly in the form of rain, has ranged from less than an inch in northwest Illinois to over 5 inches in far southern Illinois. Current measurements of soil temperatures in Illinois show that the soils under grass at 4 inches remain unfrozen. So much of that rain and melted snow should have soaked in.


Are we normal or average?
In the last few weeks I have gotten some questions and comments about using the term “normal”. In the field of applied climatology, the word “normal” has a specific meaning and refers to 30-year averages that are updated every decade. Currently we are using the 1981-2010 period for those calculations. Normals are one of the tools of trade for providing a benchmark or reference point to compare conditions at a particular time or to compare two or more stations. Other averaging periods or statistical methods can be employed in their place. For example, some utilities use a 10-year running average, updated every year, in their work. In some instances, especially if the distribution is not normally distributed, the median, or selected percentiles, may be more appropriate.
If you pull up dictionary.com or look in Webster’s Dictionary, the noun “normal” is defined as the mean or average. So in that sense, “normal”, “mean”, and “average” refer to the same thing.
Many people think of the adjective form of the word “normal”, which means that it is the most common or usual case. However, the 30-year averages were not intended to be viewed that way. In fact, I sometimes joke that it is abnormal to be normal on the rare occasion when the temperature or precipitation exactly matches the normal value.
A more mundane issue is that in writing this blog I often report things like “the statewide average temperature was 2.3 degrees above normal”. If I used the word average instead of normal, it would be “the statewide average temperature was 2.3 degrees above average” which sounds very close to saying “the … average was … above average”.
Or I could always use the longer and more complete term “the 30-year average updated every 10 years” in place of “normal”. While it is more precise, it gets to be awkward at times. Right now I’m leaning towards continuing with “normal” but give an explanation somewhere at the bottom of the post. This morning on the drive in I decided to try “long-term average” and see how that works.
Illinois in 2012 – Second Warmest and Tenth Driest on Record
2012 Summary
The year 2012 will long be remembered for the drought and the exceptionally warm temperatures. While the data for December is still preliminary, it was the second warmest and tenth driest year on record for Illinois.
The statewide average temperature for 2012 was 55.5 degrees, 3.3 degrees above normal and the second warmest year on record for Illinois. The warmest year was 1921 with 55.6 degrees. Temperatures were much warmer than normal in January-May, July, and December (figure below). For some places in Illinois it was the warmest year on record, including Chicago and Rockford (see story here).
The statewide average precipitation for 2012 was 30.37 inches. That was 9.83 inches below normal and the 10th driest year on record in Illinois. The normal annual precipitation in Illinois is 40.20 inches. Precipitation was much drier than normal in May-July and November (figure below). Here is how 2012 compared with other dry years:
- 1901 – 26.34″
- 1930 – 27.88″
- 1963 – 28.00″
- 1953 – 28.05″
- 1914 – 28.58″
- 1976 – 28.84
- 1940 – 29.33″
- 1988 – 29.71″
- 1936 – 30.24″
- 2012 – 30.37″
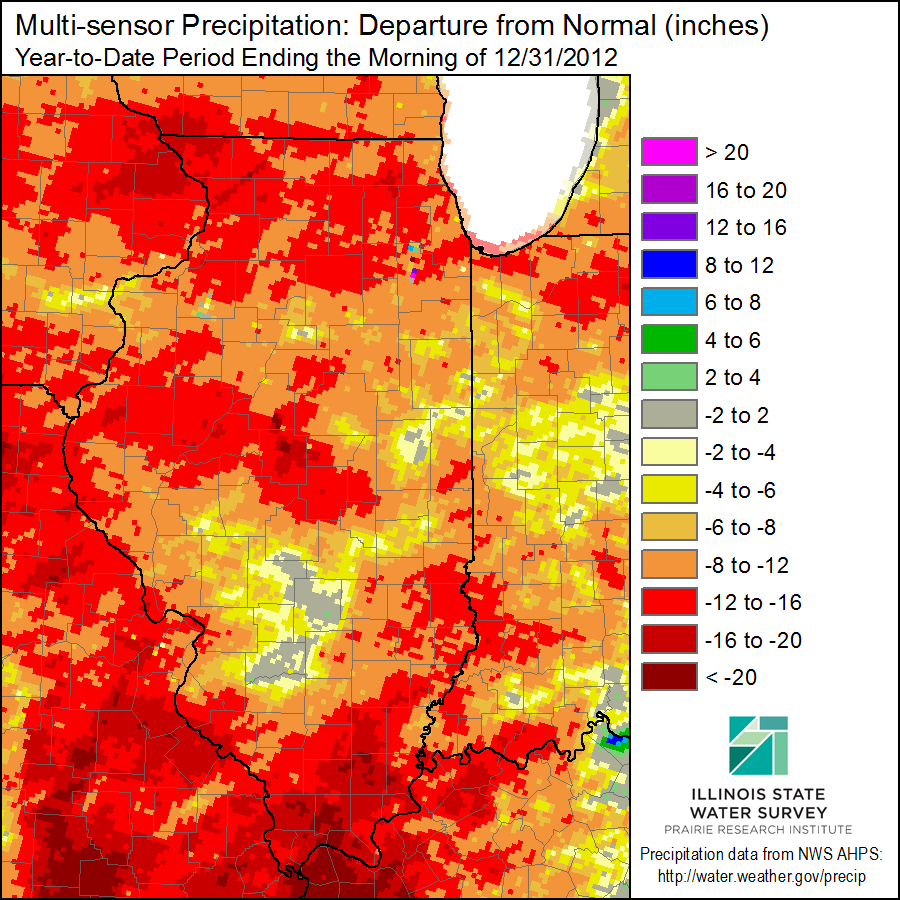
The map of the precipitation departures from normal across the state (below), as of December 31, 2012, shows large areas of the state with deficits in the range of 8 to 16 inches below normal (the darker tan and bright red colors) for 2012.
Unfortunately, winter is our driest time of year in Illinois. The normal precipitation for January and February is 2.11 and 2.12 inches, respectively. Even March is not much wetter at 2.98 inches. That adds up to 7.21 inches for those three months combined. It would take something close to record precipitation in January (6.92 inches), February (4.46 inches), and March (7.53 inches), for a total of 18.91 inches, to erase the deficits accumulated in 2012.
December 2012
The statewide average precipitation for December 2012 was 2.34 inches, just 0.4 inches below normal.
The statewide average temperature for December 2012 was 35.8 degrees, 5.9 degrees above normal and the 13th warmest December on record. The warmest December on record was 1923 with 39.7 degrees.
Figures