The statewide average precipitation for November was only 1.26 inches. That is 36 percent of normal or 2.21 inches below normal. It ranks as the 17th driest November on record since 1895. The maps below show the distribution around the state and how it compares to normal (1981-2010 average).
The statewide average precipitation from January to November was only 27.6, nearly 10 inches below the normal of 37.5 inches. What does this mean for the drought? The recovery that began in late August and through October in much of the state has stalled out.
The statewide average temperature for November was 40.8 degrees, 1.1 degrees below normal.


First Snow in Illinois

The other night we had a brief period of snow with no accumulation on the ground here in Champaign. However I did see some on my car for a few minutes (see right) before it melted. That reminded me that Zoe and I had worked on some “first snowfall” maps. These maps are based on sites that reported snowfall regularly since 1981. The dates are the earliest and median dates of the first measurable snow (0.1 inches or more) for the standard averaging period of 1981 to 2010 (also known as “normal”).
No real surprises for anyone who has experienced winter in Illinois. The earliest dates are in the late October, early November time frame. And the median dates range from late November in northern Illinois to the second half of December in southern Illinois. Even so, the dates can vary considerably between nearby sites since many of the early season snows are sporadic and not very widespread.
The median is also known as the 50th percentile and represents in the “middle” of the distribution of dates. In many cases it is a better measure than the average, which can be thrown off by some date that is extraordinarily early or late.


Why the Low Water Levels on the Mississippi River
There has been much concern with the low river stages on the Mississippi River between St. Louis and Cairo, IL, and what that means for barge traffic, for example here and here.
How bad is it? The first graph shows the river stage at Chester, IL, from January 2011 to present. The river was actually above flood stage for much of May-July 2011. It dropped from almost 40 feet during that time to 5 feet in November 2011. Then it fluctuated between 5 and 25 feet, until this summer when it dropped below 5 feet and into negative numbers in late September. The latest forecast from the NWS has the river stage reaching -2 feet by December 10 (second figure). By the way, you can get negative river gauge heights because the reference point on the gauge (zero) may not always be the bottom of the river.
The reason for the low river stages in the stretch between St. Louis and Cairo is that much of the Upper Mississippi River basin and the entire Missouri River basin are in some stage of drought, according to the U.S. Drought Monitor (last figure). For the Missouri River basin, 90 percent of the basin is either abnormally dry or in some stage of drought. In fact, 41 percent of the basin is in D3 or D4, the two worst categories of drought.
Conditions are just as bad on the Upper Mississippi with 96 percent of the basin either abnormally dry or in some stage of drought. However, only 17 percent of the basin is in D3 or D4 drought. So drought is a little more widespread but not as severe in the Upper Mississippi River basin as it is in the Missouri River basin. Unfortunately, the latest NWS drought outlook indicates that the drought is expected to continue across much of these two basins through this winter.
| None | D0-D4 | D1-D4 | D2-D4 | D3-D4 | D4 | |
|---|---|---|---|---|---|---|
| Missouri River | 10.3 | 89.7 | 82.8 | 67.1 | 41.2 | 21.9 |
| Upper Mississippi River | 4.4 | 95.6 | 76.9 | 34.9 | 16.5 | 0 |


Latest Outlook for this Winter in Illinois
The NWS Climate Prediction Center posted their latest outlook for December and December – February (winter). The temperature outlook for December is for equal chances (EC) for above, below, and near-normal temperatures. The precipitation outlook for December is a little more interesting with an increased chance of above normal precipitation in the southern half of Illinois. The rest of the state is in the EC category.
There is not much to report on the December-February outlook for Illinois with the state in EC for both temperature and precipitation, except for an increased chance of above-normal precipitation in far southern Illinois.
Part of the reason for the bland outlooks is that the Climate Prediction Center expects near-normal temperatures in the eastern Pacific Ocean along the equator. That means there is no El Niño or La Niña expected for this winter.
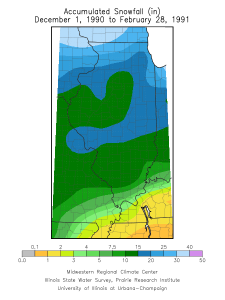
I looked at three winters that had a similar setup in the Pacific Ocean (slightly raised sea-surface temperatures but not a full-blown El Niño event). They are the winters of 1979-80, 1990-91, and 2003-04. In Illinois, each of these winter were slightly warmer than normal – on average by half a degree. Two out of the three had below-average precipitation (1979-80 was 2.2 inches short, 2003-04 was 1.3 inches short, while 1990-91 was 1.4 inches above). All three had below-average snowfall in the north. However, two out of three had above-average snowfall in southern Illinois (1979-80 and 1990-91). See the maps below for more details on snowfall.


