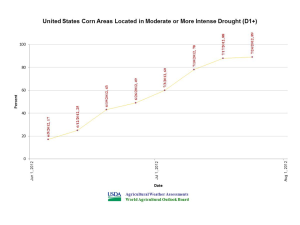
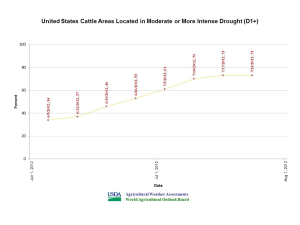
The USDA has produced some interesting slides for the World Agricultural Outlook Board, showing the current drought overlaid on production areas. The first two are about the U.S. corn production areas, then the soybean areas, and finally the cattle areas. Each pair of slides shows a map of the overlay, and a time series of the area affected by drought.
By July 24, about 89 percent of the corn production area was in drought. That percentage has been climbing steadily since early June. It’s the same story with 88 percent of the soybean production area and 73 percent of the cattle production area in drought.


