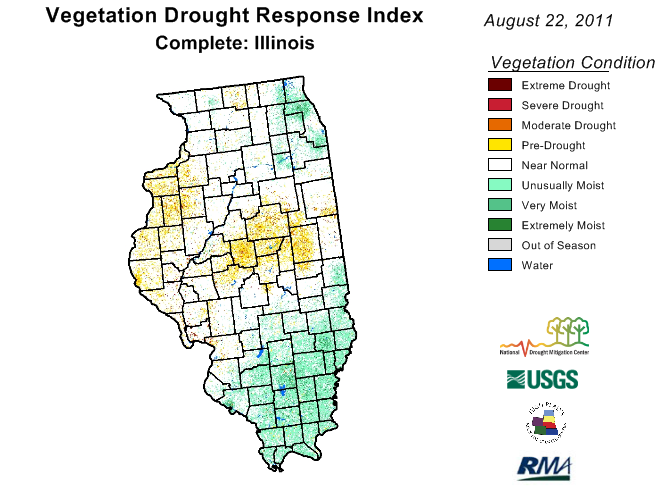
There is a new way to look at drought stress in Illinois – from space. Called VegDRI, this product integrates “satellite-based observations of vegetation conditions, climate data, and other biophysical information such as land cover/land use type, soil characteristics, and ecological setting. The VegDRI maps that are produced deliver continuous geographic coverage over large areas, and have inherently finer spatial detail (1-km resolution) than other commonly available drought indicators such as the U.S. Drought Monitor,” according to the VegDRI website.
In other words, it looks at crop stress as it relates exclusively to drought. The maps are updated every two weeks.
The August 22, 2011, map below shows that crops in much of western and central Illinois are showing much stress from the lack of rain and high temperatures in July and August. If you go to the VegDRI website, you can see a national map. Click on a state to get a closer view. Scroll down the state page and click on the quadrant map of the state so see even more detail.


The National Drought Mitigation Center produces VegDRI in collaboration with the US Geological Survey’s (USGS) Center for Earth Resources Observation and Science (EROS), and the High Plains Regional Climate Center (HPRCC), with sponsorship from the US Department of Agriculture’s (USDA) Risk Management Agency (RMA). Main researchers working on VegDRI are Dr. Brian Wardlow and Dr. Tsegaye Tadesse at the NDMC, and Jesslyn Brown with the USGS, and Dr. Yingxin Gu with ASRC Research and Technology Solutions, contractor for the USGS at EROS.
Extreme Dryness in August for Much of Illinois
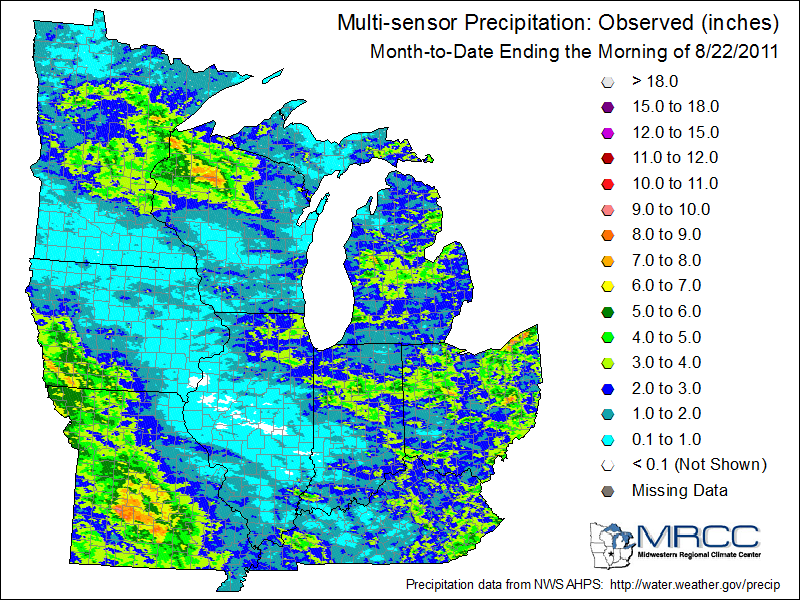
While the rains continue in northeastern Illinois, much of the rest of the state has been bone dry in August. Rainfall totals range from 3-5 inches in the Chicago area to less than an inch in many locations across central and southern Illinois. This band of dryness extends from southern Minnesota, eastern Iowa, Illinois, and into parts of Indiana and Kentucky (see first map).
Rainfall departures are on the order of 1-2 inches below average in the driest areas. Some of those same areas received little rainfall in July. The US Drought Monitor has much of central and southern Illinois in at least “moderately dry” with “moderate drought” in the central region of the state.
Of particular concern to me is that the few opportunities for substantial rain in August across central Illinois have resulted in only scattered showers/thunderstorms at best. There is another chance of rain on Tuesday/Wednesday but the projected amounts are on the order of 0.25 inches or less.
Update: USDA, National Ag Statistics Service (NASS) released the following on Illinois topsoil moisture (percent) by crop reporting district:
| District | Very Short | Short |
|---|---|---|
| Northwest | 4 | 21 |
| Northeast | – | 18 |
| West | 49 | 44 |
| Central | 31 | 38 |
| East | 40 | 44 |
| West Southwest | 26 | 58 |
| East Southeast | 13 | 46 |
| Southwest | 20 | 40 |
| Southeast | 30 | 56 |
| State | 25 | 41 |


New Climate Normals for Illinois
The new 1981-2010 climate normals are available for Illinois. You can find them through a station list or a Google Map on my homepage.
Climate normals are 30-year averages that are updated every 10 years in the U.S. The National Climatic Data Center produces the climate normals for the US. By settling on a standard averaging period, users are able to compare climate conditions between two or more locations.
By updating every 10 years, the climate normals can reflect data from newer stations as well as reflect any changes to the climate. One impact of switching from the 1971-2000 to the 1981-2010 climate normals was that the cold, snowy winters of the 1970s fell out of the calculations. As a result, the new normal snowfall has dropped a little in most places. For example, the new normal annual snowfall is 3 inches less in Champaign-Urbana.
The National Climate Data Center has a climate normals page dedicated to the new climate normals and frequently asked questions.
Drought Arrives in Central Illinois
The U.S. Drought Monitor had introduced D1 “moderate drought” into central Illinois. This is based primarily on very low rainfall totals of less than an inch in the last 30 days in this region, combined with temperatures that were 4 to 5 degrees above normal. The Illinois Ag Statistics Service note that the topsoil moisture was “very short” in:
- the West Crop Reporting District (CRD) at 38%
- the Central (CRD) at 14%
- the East (CRD) at 51%


