Heat Index Extremes for Illinois

Since heat and humidity is on everyone’s mind these days, I pulled out the record high heat index values that we calculated for the Illinois Climate Atlas from a few years ago.
For that analysis we looked at the few sites with long-term temperature and humidity records. Here is what we found for the highest heat index value at each site:

  • Chicago’s record is a heat index of 118 degrees on July 13, 1995 (temperature 100°F, relative humidity 50%)
  • Rockford’s record is a heat index of 119 degrees on July 13, 1995 (temperature 98°F, relative humidity 57%)
  • Peoria’s record is a heat index of 121 degrees on July 13, 1995 (temperature 99°F, relative humidity 53%)
  • Springfield’s record is a heat index of 118 on July 15, 1980 (temperature 98°F, relative humidity 56%)
  • St. Louis’s record is a heat index of 119 on July 13, 1995 (temperature of 100°F, relative humidity 51%)

As you may have noticed, most of the cities set their record during the deadly July 1995 heat wave. I included St. Louis because it is just across the river.
I have seen unofficial heat index values even higher from locations at smaller airports.  Some of those sites have reported heat index values in the mid to upper 120s. However, we don’t normally use them for record keeping. For one thing the humidity sensor has a reputation of becoming unreliable at times. For another thing the archive of those observations extends back to 15 years or less at most sites.

Dangerous Heat and Humidity in Illinois

The National Weather Service (NWS) has issued a variety of heat warnings and advisories for Illinois this week. The combination of temperatures in the upper 90s and high levels of humidity mean a greater risk of heat-related illnesses and death.
One measure that combines both the effects of temperature and humidity is the heat index. Explanations of the heat index can be found on Wikipedia and NWS. Below is a chart showing the heat index for a given temperature and relative humidity. If you like to do your own calculations, here is the NWS heat index calculator.
While the heat index incorporates relative humidity to give a better idea of what the temperature feels like, there are some important underlying assumptions. It assumes a person who is 5′ 7″, 147 lbs, walking at 3 mph, wearing long pants and a short-sleeve shirt, in the shade with a light breeze. It is estimated that working out in the sun would increase the heat index by 15°F.
Here are some resources to consider for monitoring the heat and what to do during the current heat wave:

HEAT INDEX
RELATIVE HUMIDITY (%)
Temp. 40 45 50 55 60 65 70 75 80 85 90 95 100
110 136
108 130 137
106 124 130 137
104 119 124 131 137
102 114 119 124 130 137
100 109 114 118 124 129 136
98 105 109 113 117 123 128 134
96 101 104 108 112 116 121 126 132
94 97 100 103 106 110 114 119 124 129 135
92 94 96 99 101 105 108 112 116 121 126 131
90 91 93 95 97 100 103 106 109 113 117 122 127 132
88 88 89 91 93 95 98 100 103 106 110 113 117 121
86 85 87 88 89 91 93 95 97 100 102 105 108 112
84 83 84 85 86 88 89 90 92 94 96 98 100 103
82 81 82 83 84 84 85 86 88 89 90 91 93 95
80 80 80 81 81 82 82 83 84 84 85 86 86 87
Category Heat Index Possible heat disorders for people in high risk groups
Extreme Danger 130° or higher Heat stroke or sunstroke likely.
Danger 105 – 129° Sunstroke, muscle cramps, and/or heat exhaustion likely. Heatstroke possible with prolonged exposure and/or physical activity.
Extreme Caution 90 – 105° Sunstroke, muscle cramps, and/or heat exhaustion possible with prolonged exposure and/or physical activity.
Caution 80 – 90° Fatigue possible with prolonged exposure and/or physical activity.

30-Day Dry Spot in Corn Belt

As of July 13, 2011, the map of 30-day precipitation departures (figure below) showed a large area of below-average precipitation extending from eastern Iowa, through Illinois and Wisconsin and into parts of Michigan, Indiana, and Ohio. At first, this was not a concern because of the wet conditions that occurred through much of the spring. However, the lack of rainfall and hot conditions in the first part of July have begun to dry out the topsoil in Illinois. The rainfall departures range from 0.5 to 3 inches below average across northern and eastern Illinois.
Comparing the NASS report for  July 5 and July 11:

  • the Northwest crop reporting district (CRP) went from 11% dry to very dry topsoil to 30% dry to very dry in one week
  • the Northeast CRP went from 4% dry to very dry to 29% dry to very dry in one week
  • the East CRP went from 12% dry to very dry to 37% dry to very dry in one week.

The potential loss of water from soils from evaporation and transpiration from crops is on the order of 0.2 inches per day in Illinois now (link to potential evapo-transpiration maps). That means that we need about 1.4 inches of rain per week in July just to keep up with the demand from the crops. If the crops don’t get the water from rainfall then they have to rely more on soil moisture. So a week with no rain and temperatures in the 90s can dry out the topsoil quickly.
According to the Crop Watchers in the Illinois Farm Bureau’s FarmWeek, corn and soybeans in the sandy soils and in the thin soils on the ridges are showing signs of stress. Today we have seen slightly cooler temperatures across Illinois, along with some rain. However, the NWS is forecasting a return of hot weather over the weekend. In addition the NWS 6-10 day and 8-14 day forecast show a greater chance of above-average temperatures across all of Illinois. Those forecasts show a greater chance of below-average rainfall across the southern two-thirds of the state and near-to-above average rainfall in the northern third of the state.
While northern Illinois has been dry, much of southern and western Illinois has received much-above average rainfall, by as much as 2 to 5 inches or more in many locations. The wet conditions have led to flooded fields and widespread planting/replanting delays.

30-day precipitation departure
The 30-day precipitation departure as of July 13, 2011. Area circled in red shows less-than-average amounts. Source NOAA. Click to enlarge.

Wild Weather in Chicago Area

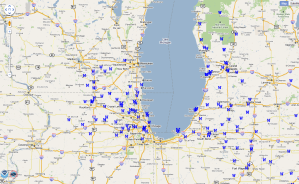
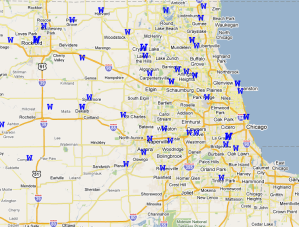
The severe thunderstorms that swept though Chicago on July 11, 2011, caused widespread damage. Here are the maps and initial reports of damages from the NOAA Storm Prediction Center. The wind damage was common throughout Chicago, as well as parts of southeastern Wisconsin, Indiana, and Michigan.
Some parts of the Chicago area received up to 0.75 inches of rain from this event, according to the reports from the Community Collaborative Rain, Hail, and Snow  network (CoCoRaHS). See last map below.

Summary of Damage Reports (PDF)

Storm Reports for July 11
Storm Reports for July 11, 2011, for the Midwest. Click to enlarge.

Storm Reports for July 11
Storm Reports for July 11, 2011, for the Chicago area. Click to enlarge.

July 11 rainfall
July 11, 2011, rainfall from the CoCoRaHS network (cocorahs.org). Click to enlarge.