At the national level, 2011 has become a very active tornado season. While the reports are preliminary, the number of tornadoes this year stands at 1189. And we are only five months into the year. At least 483 people have died this year, compared to 45 in 2010 and 21 in 2009.
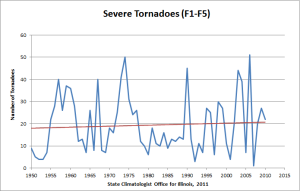
I’ve been asked by several people if there are any trends in the tornado records for Illinois. If we look at the number of stronger tornadoes since 1950 in Illinois, we see a lot of year to year variability. However there is no significant trend over time – either up or down (Figure 1). Stronger tornadoes are identified here as F-1 to F-5 events from 1950 to 2006 (using the Fujita Scale), and EF-1 to EF-5 events from 2007 to 2010 (using the Enhanced Fujita Scale). By definition, these stronger tornadoes cause at least a moderate amount of damage. See the Storm Prediction Center for a discussion on the original Fujita and Enhanced Fujita (EF) scales.

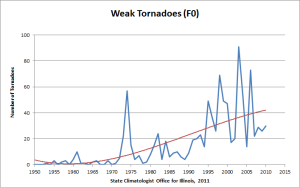
What we have seen is a dramatic increase in the number of F-0 (EF-0) tornadoes from 1950 to 2010 (Figure 2). These are the weakest of all tornado events and typically cause little if any damage. These events were overlooked in the early tornado records. The upward trend is the result of better radar systems, better spotter networks, and increased awareness and interest by the public. These factors combined have allowed for a better documentation of the weaker events over time.

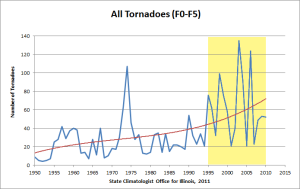
If we combine both data sets together, we see the apparent upward trend caused by the increasingly accurate accounting of F-0 (EF-0) tornadoes (Figure 3). As a result, the number of observed tornadoes in Illinois has increased over time, but without an indication of any underlying climate change.In my opinion, the tornado record since 1995 (shaded in yellow) provides the most accurate picture of tornado activity in Illinois. From that part of the record we see that the average number of tornadoes per year in Illinois is now 63.

May Rainfall in Illinois – Wet in the South, Dry Elsewhere
Rainfall amounts in May varied widely across Illinois. Much of northern and central Illinois received between 2 and 3 inches of rain. Meanwhile, southern Illinois had widespread amounts of 4 to 7 inches. The highest total for May was Cairo with 7.46 inches of rain. Not far behind it were Grand Chain Dam with 6.80 inches and Carbondale with 6.79 inches.
As of May 24, much of northern and central Illinois are slightly below average on rainfall, which has greatly helped with field work. As of May 22, 90 percent of the corn and 47 percent of the soybeans had been planted. Both numbers are slightly ahead of the 5-year average.
Drier-than-average conditions occurred in northern Missouri, much of Iowa, and southern Wisconsin. Wetter-than-average conditions occurred in Minnesota, southern Missouri, and much of Michigan, Indiana, Ohio, and Kentucky.

Tornado Deaths and Injuries in Illinois – No Upward Trends
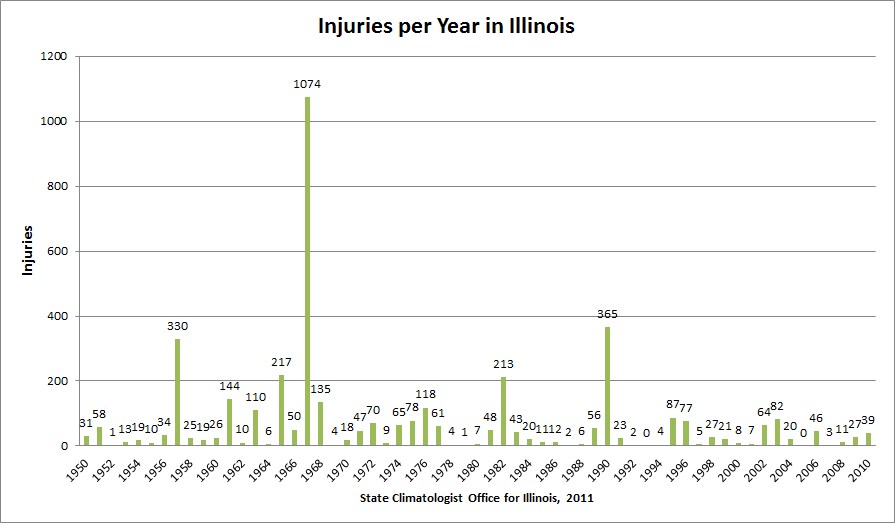
Recently, an undergraduate in the Department of Atmospheric Science at the University of Illinois helped me look at the tornado statistics for Illinois. Among the things we plotted were the number of deaths and injuries reported in Illinois since 1950.
The first thing you will notice in both the deaths and injuries per year are the standout years of 1967 and 1990. The high numbers in 1967 were due to the Belvidere-Oak Lawn tornado outbreak of April 21, 1967. The high numbers in 1990 were due to the Plainfield tornado of August 28, 1990. As events have shown this year, despite our best efforts at warnings and preparations, an EF-4 or EF-5 tornado in an urban area will create significant casualties.
The second thing you will notice is that there are no upward trends in the deaths and injuries per year in Illinois despite our population increasing from 8.7 million in 1950 to 12.8 million in 2010. Some earlier research on Illinois tornadoes has shown that while we are detecting more EF-0 tornadoes (the weakest category) due to improved technology, we are seeing about the same number of EF-1 to EF-5 tornadoes through time.
By the way, the “EF” or “Enhanced Fujita” scale rates tornadoes from EF-0 (weakest) to EF-5 (strongest) based on damage. See Enhanced Fujita scale for more information.


Links to Useful Severe Weather Websites
I enjoyed the opportunity to speak at Tom Skilling’s Severe Weather Seminar at Fermi Lab on Saturday, April 30. During my talk I mentioned some web sites that I use for looking at past severe weather events. As promised, I am posting them here for you to use.
Storm Prediction Center
In the “reports” section of the SPC website you will find day-to-day reports of severe weather with maps and tables describing the activity on each day. Farther down the page are reports and maps for each year and other products. I find this a real gold mine for severe weather information.
Screenshots (click to enlarge):

Experimental Local Storm Reports
The San Diego NWS site has “experimental” local storm reports presented with Google Maps. The interface allows to you to selected the kinds of weather reports you want to see on the map, as well as a date range. Icons are used to represent different types of events and you can click on them to get more details.
Screenshots (click to enlarge):

National Severe Storm Laboratory
The National Severe Storm Laboratory in Normal OK has two radar-derived products useful for severe weather studies: a) rotation tracks and b) MESH (Maximum Expected Size Hail). I found this site to be more of a challenge to use than some of the others. Even so, the results are spectacular as shown below with the rotation tracks from April 27-28, 2011.


