Maps of current precipitation, mean temperature, maximum temperature, minimum temperature, and snowfall in Illinois. These maps typically update by 11 am each day. Additional maps for the Midwest are available from the Applied Climate Information System.
Precipitation
| Total (inches) | Departure from Average (inches) | Percent of Normal |
| Last 7 Days | 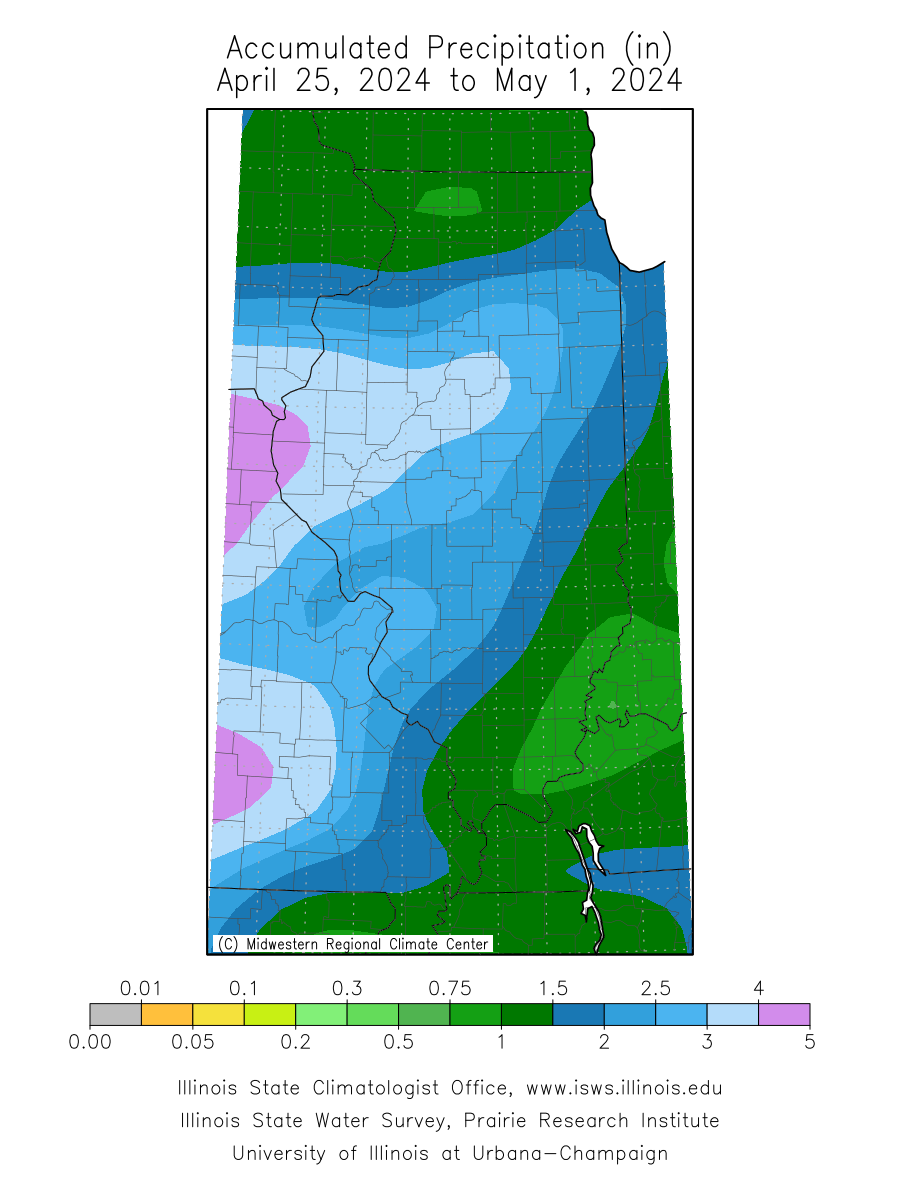 | 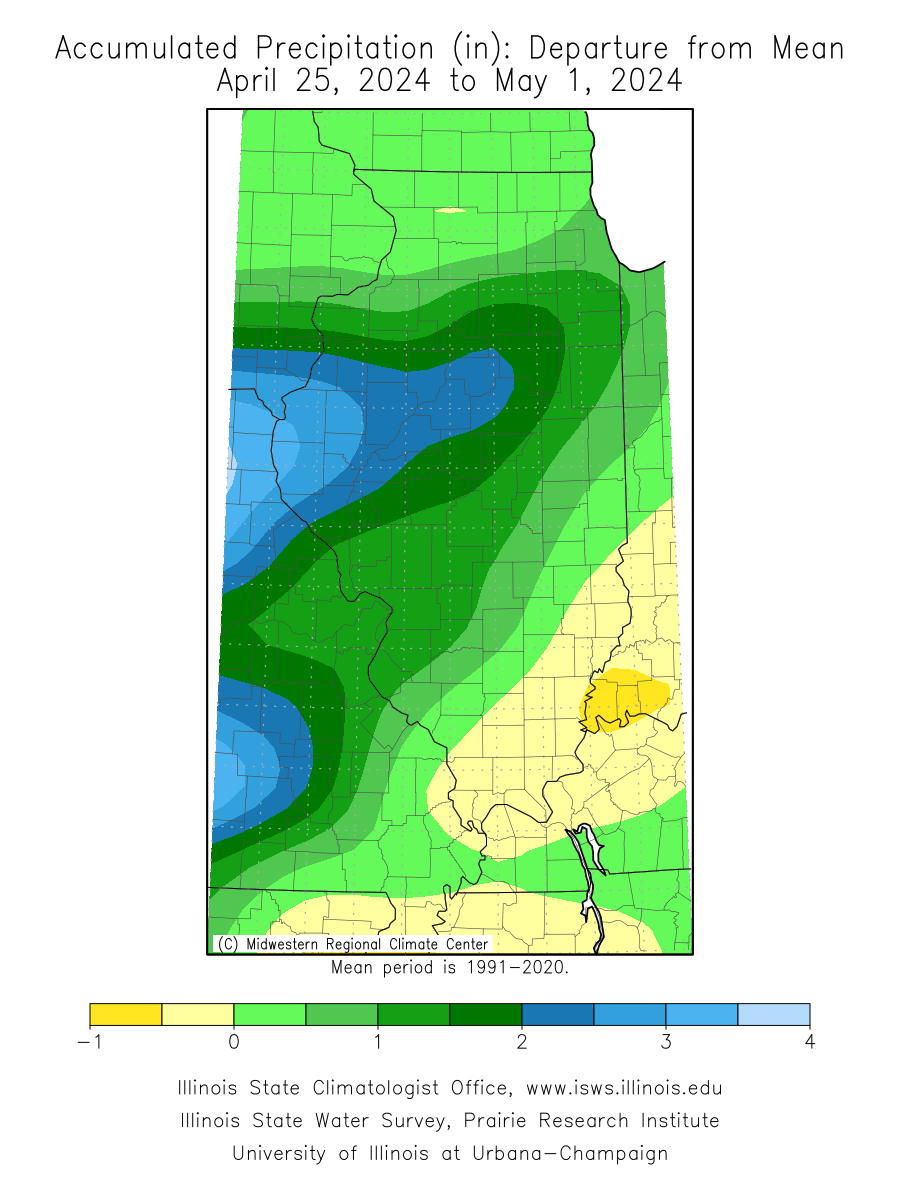 | 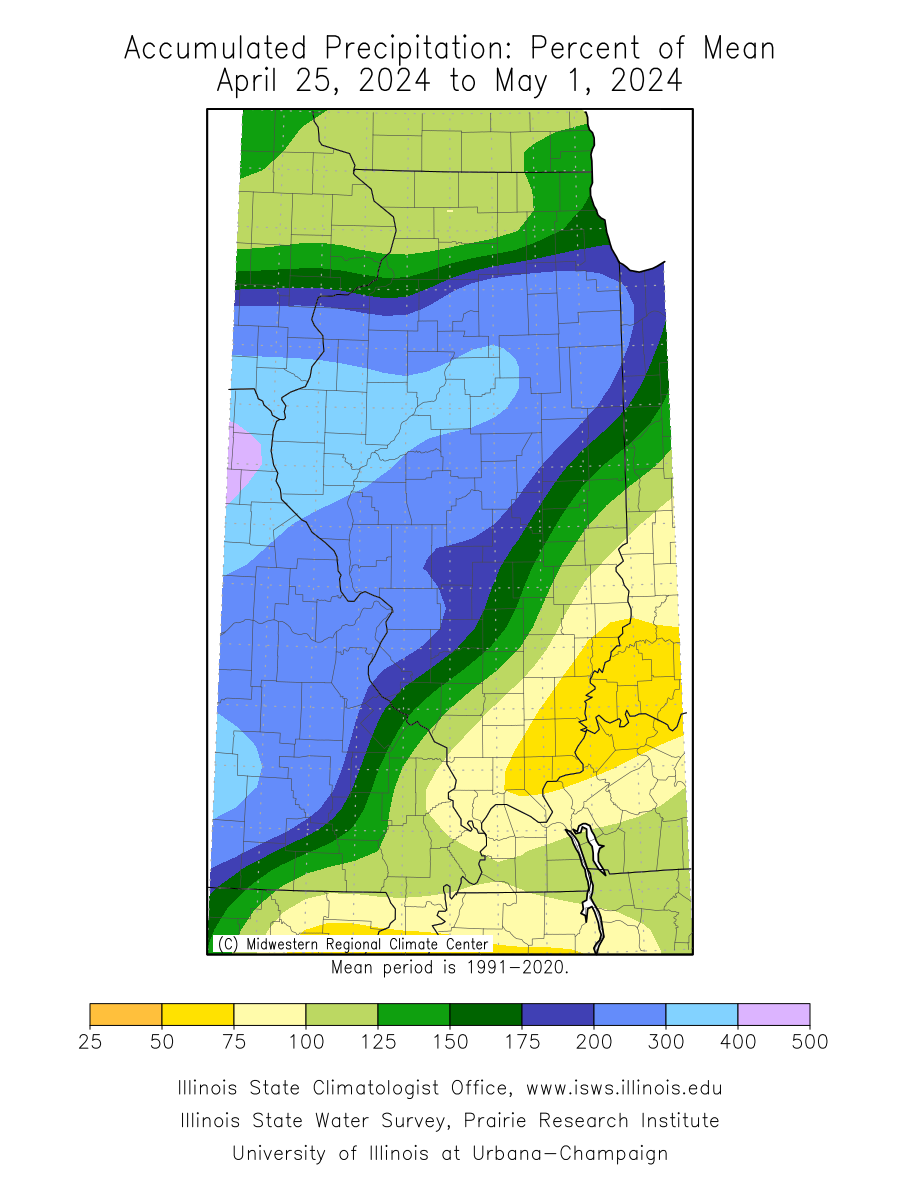 |
| Last 30 Days | 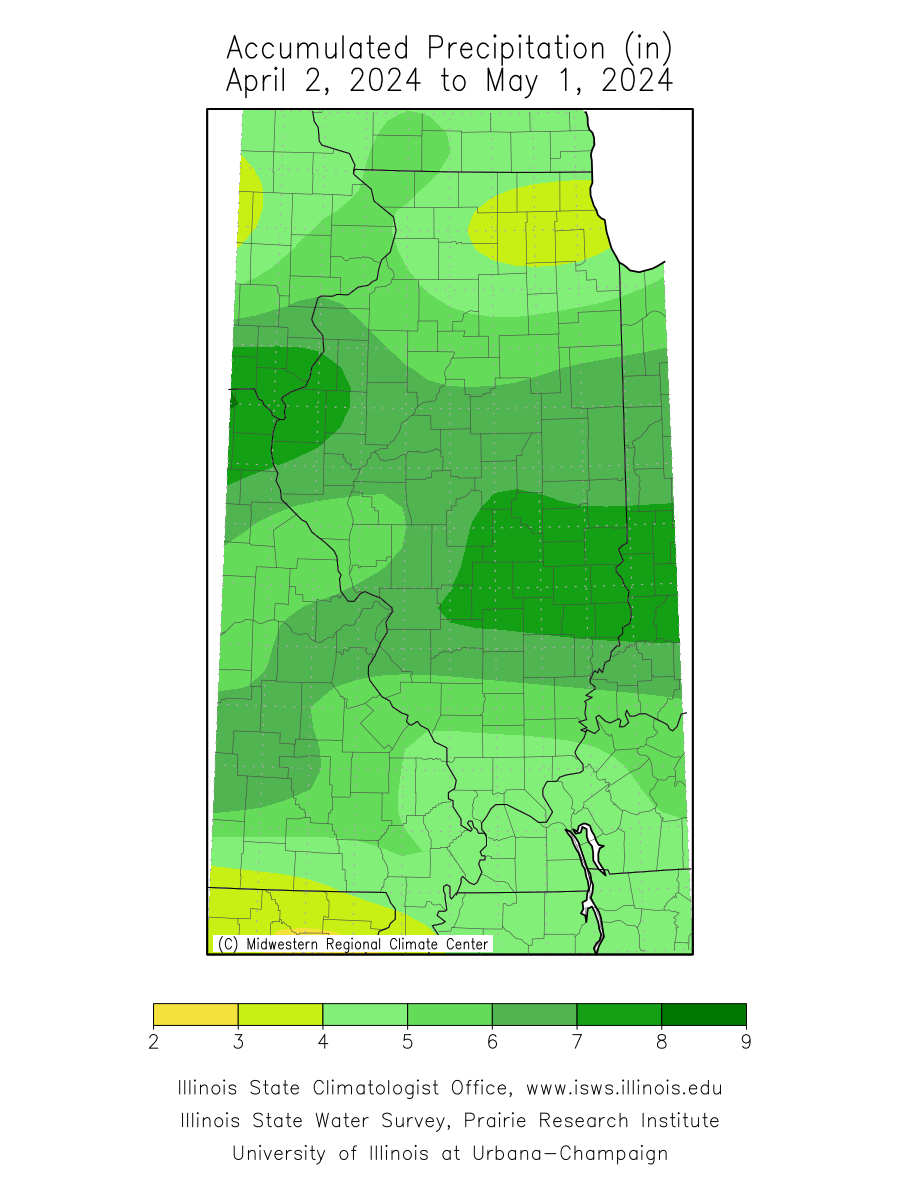 | 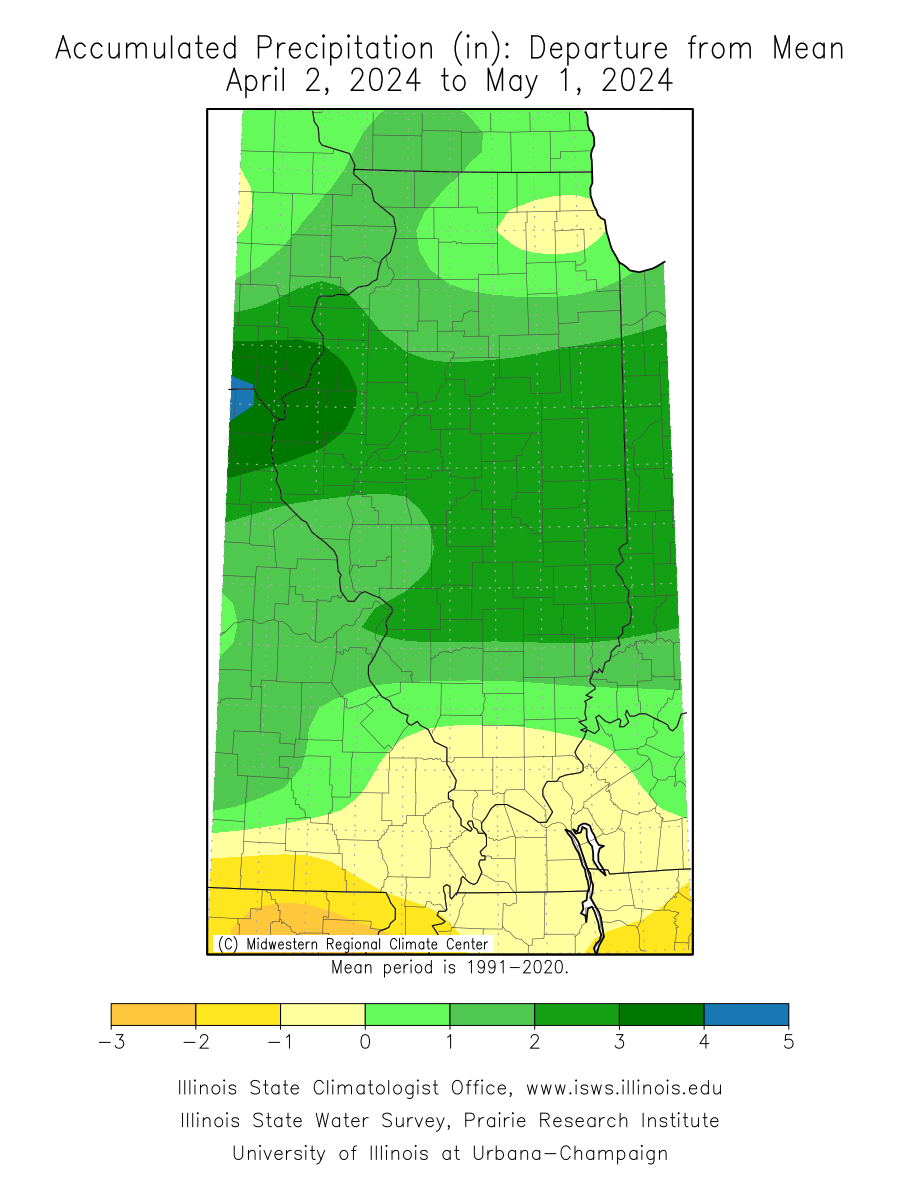 | 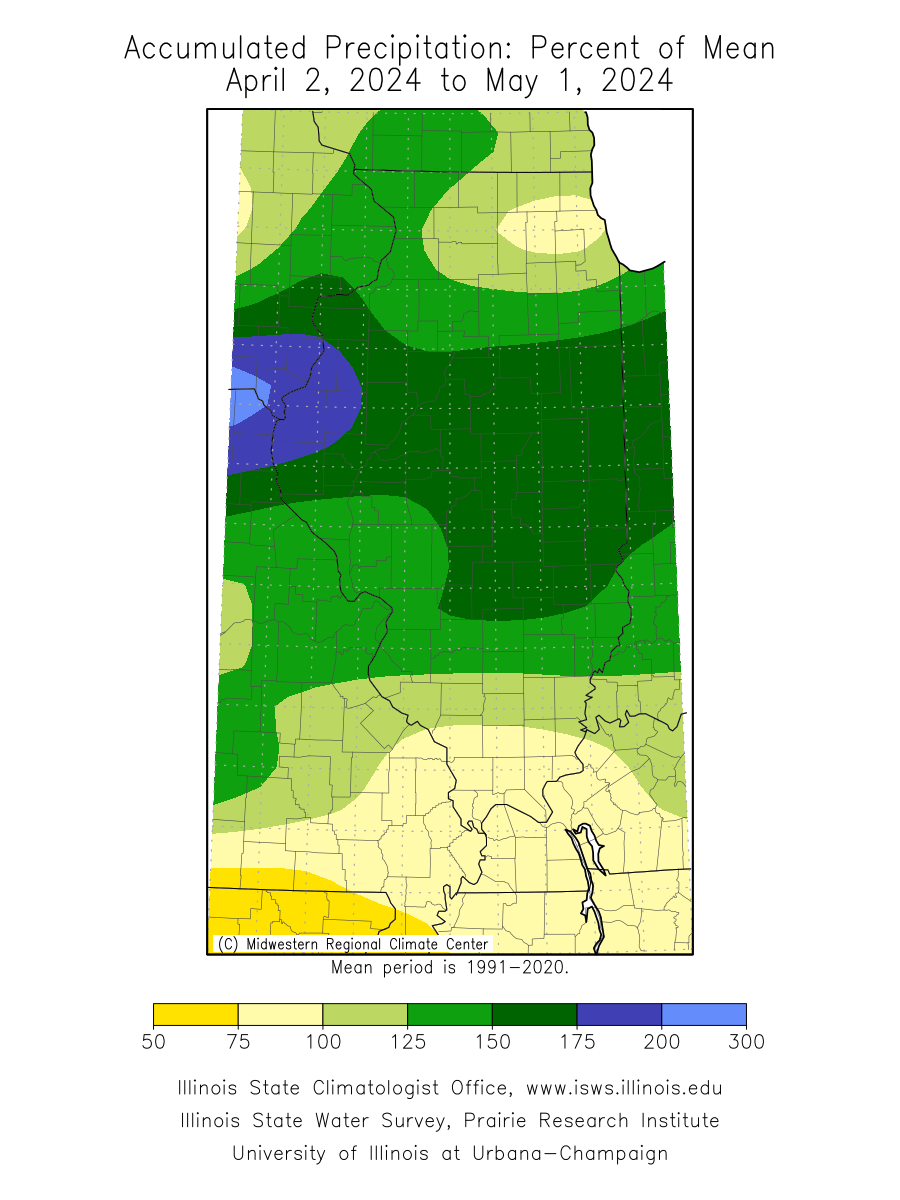 |
| Last 90 Days | 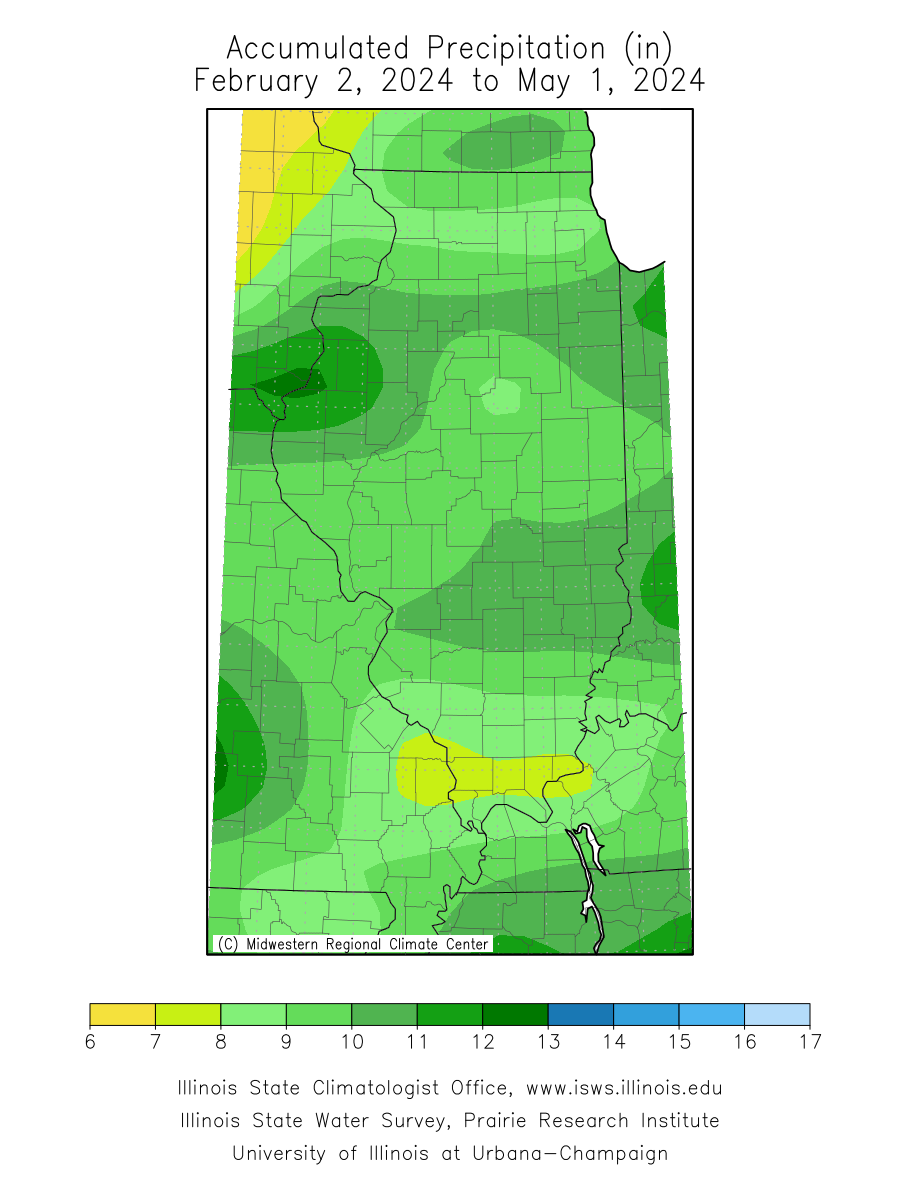 | 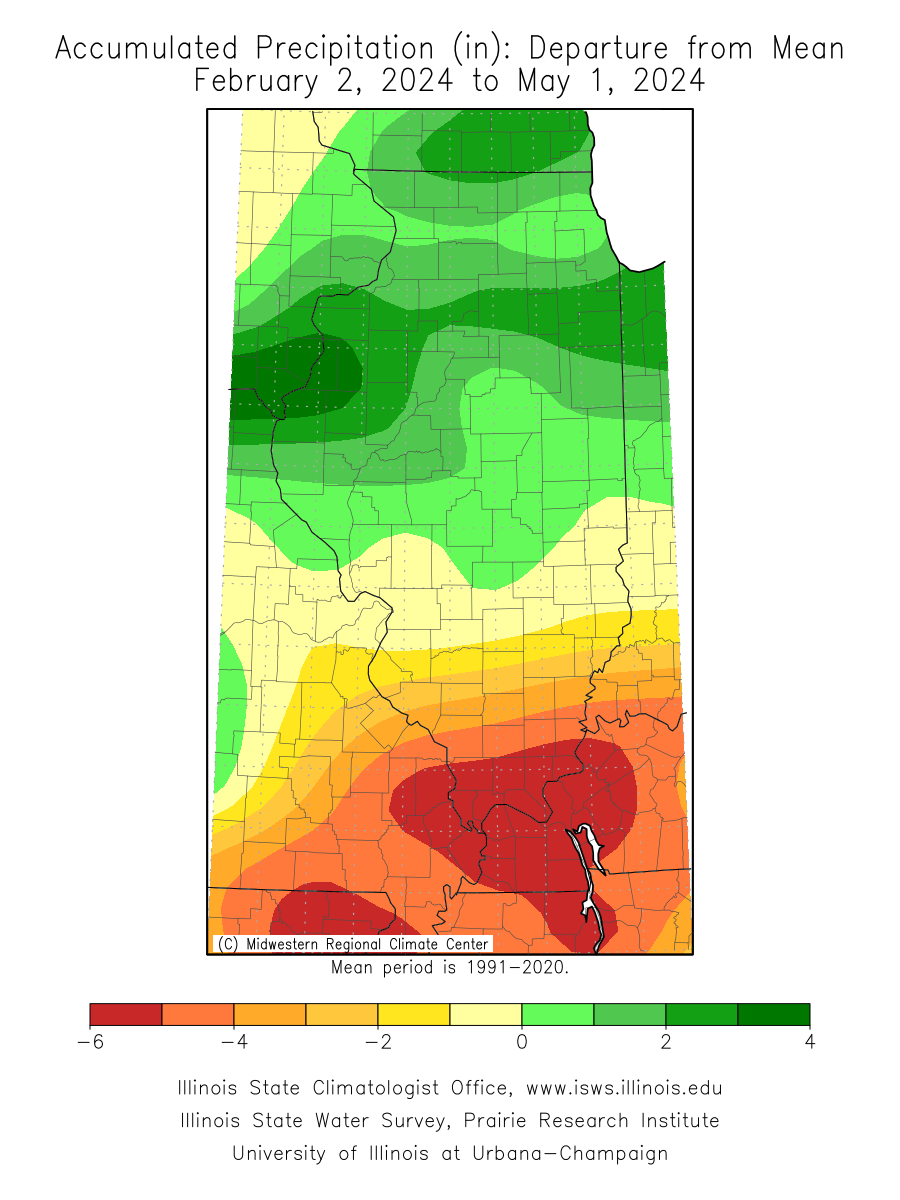 | 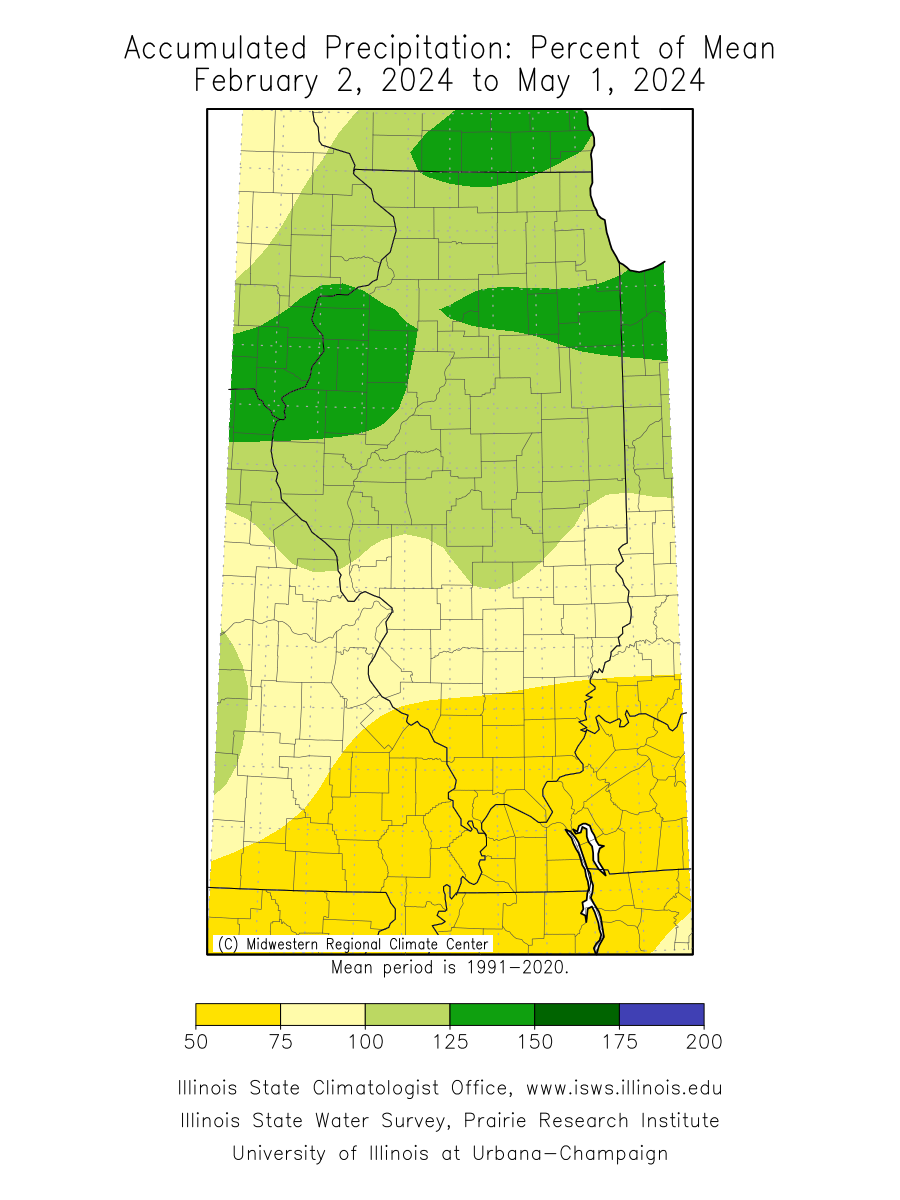 |
| Month to Date | 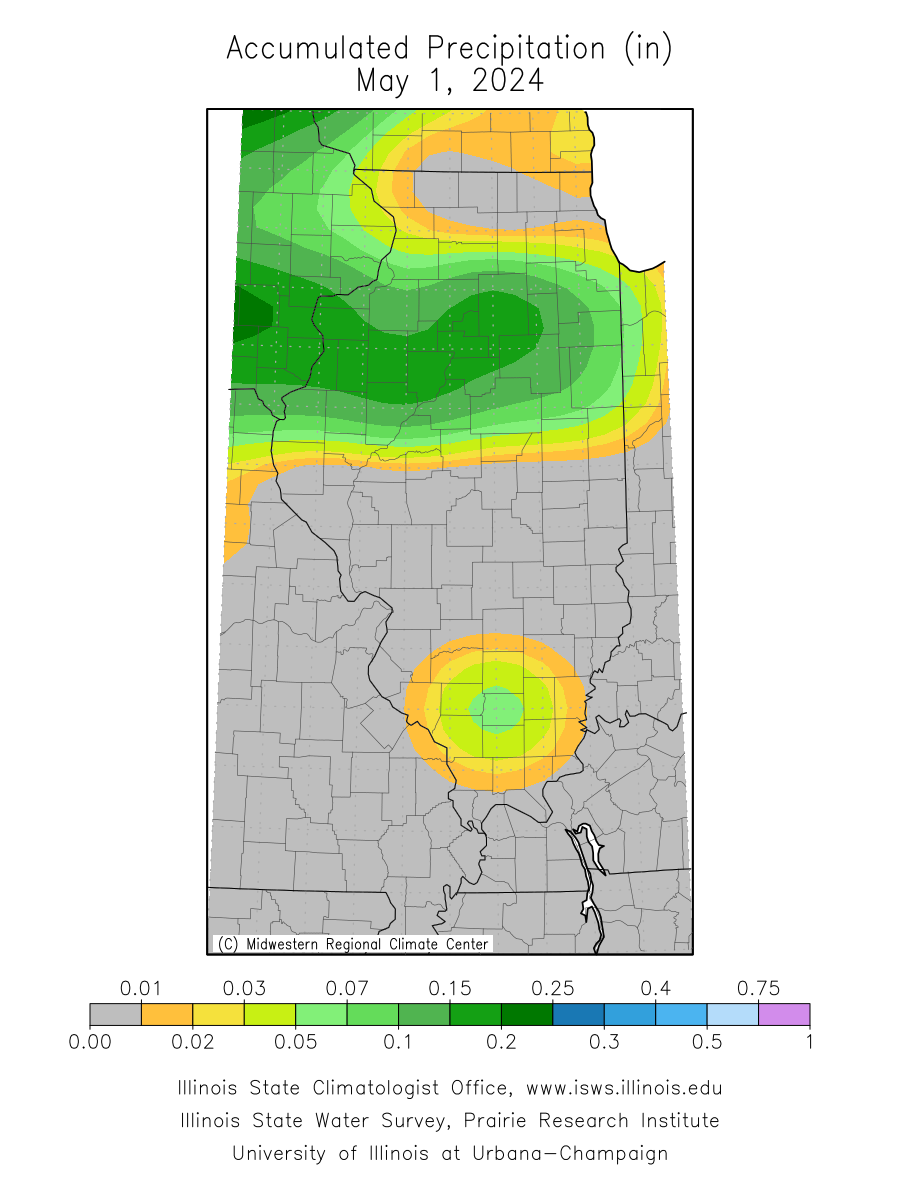 | 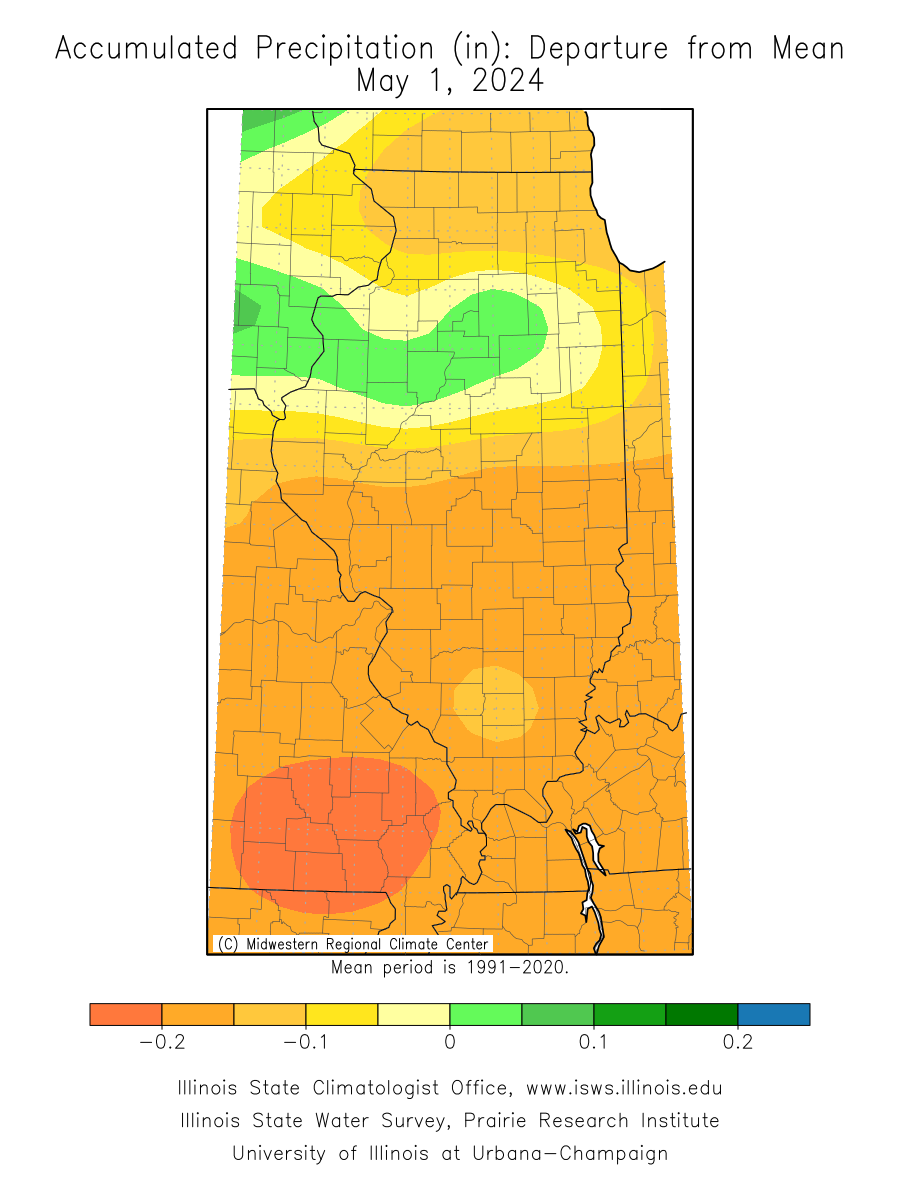 | 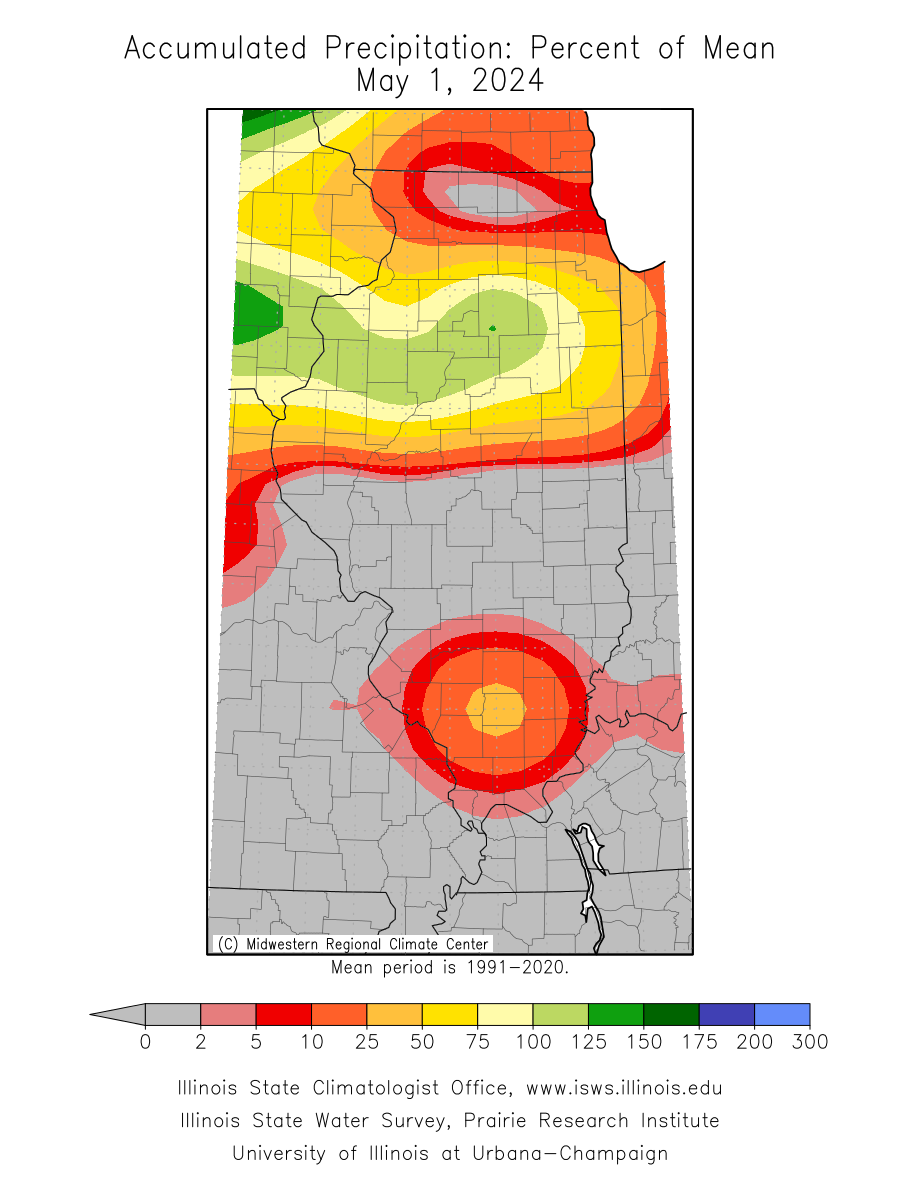 |
| Year to Date | 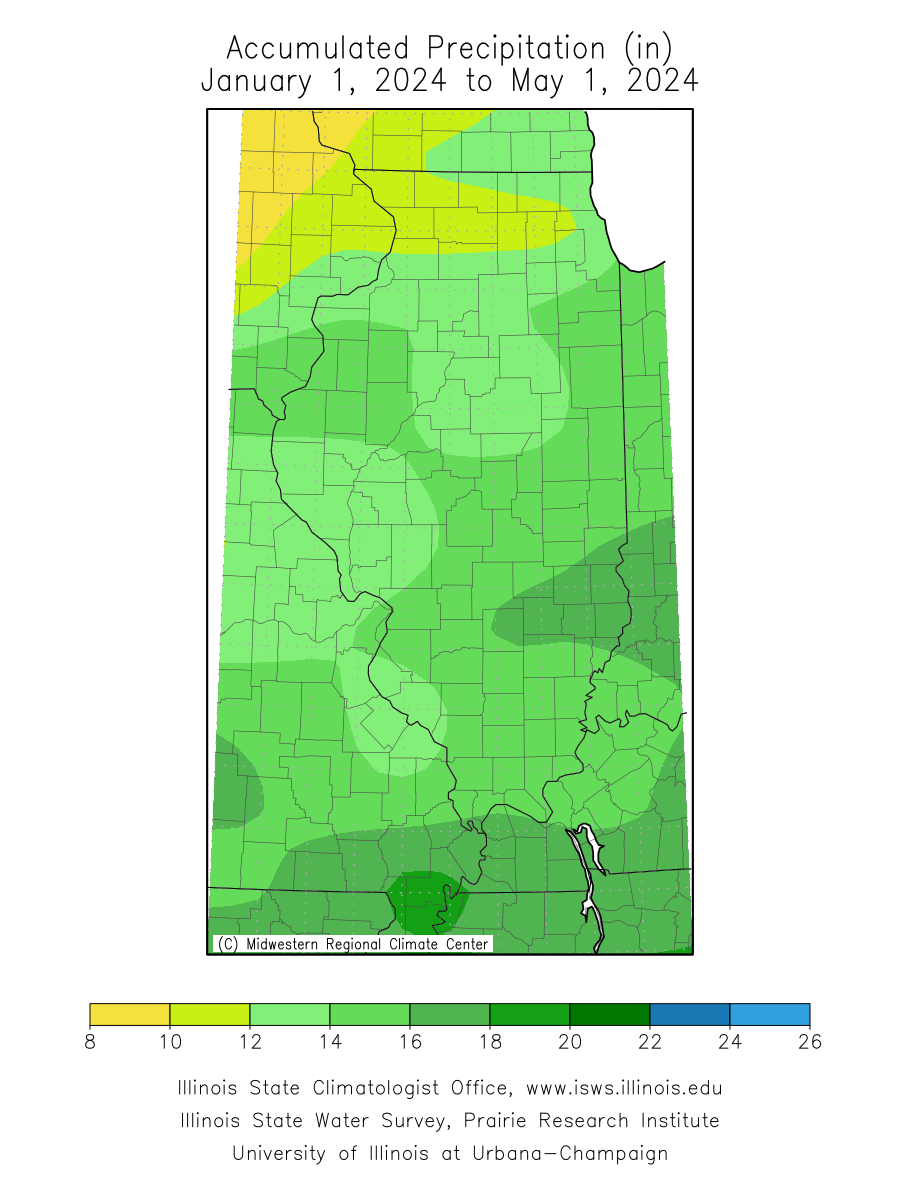 | 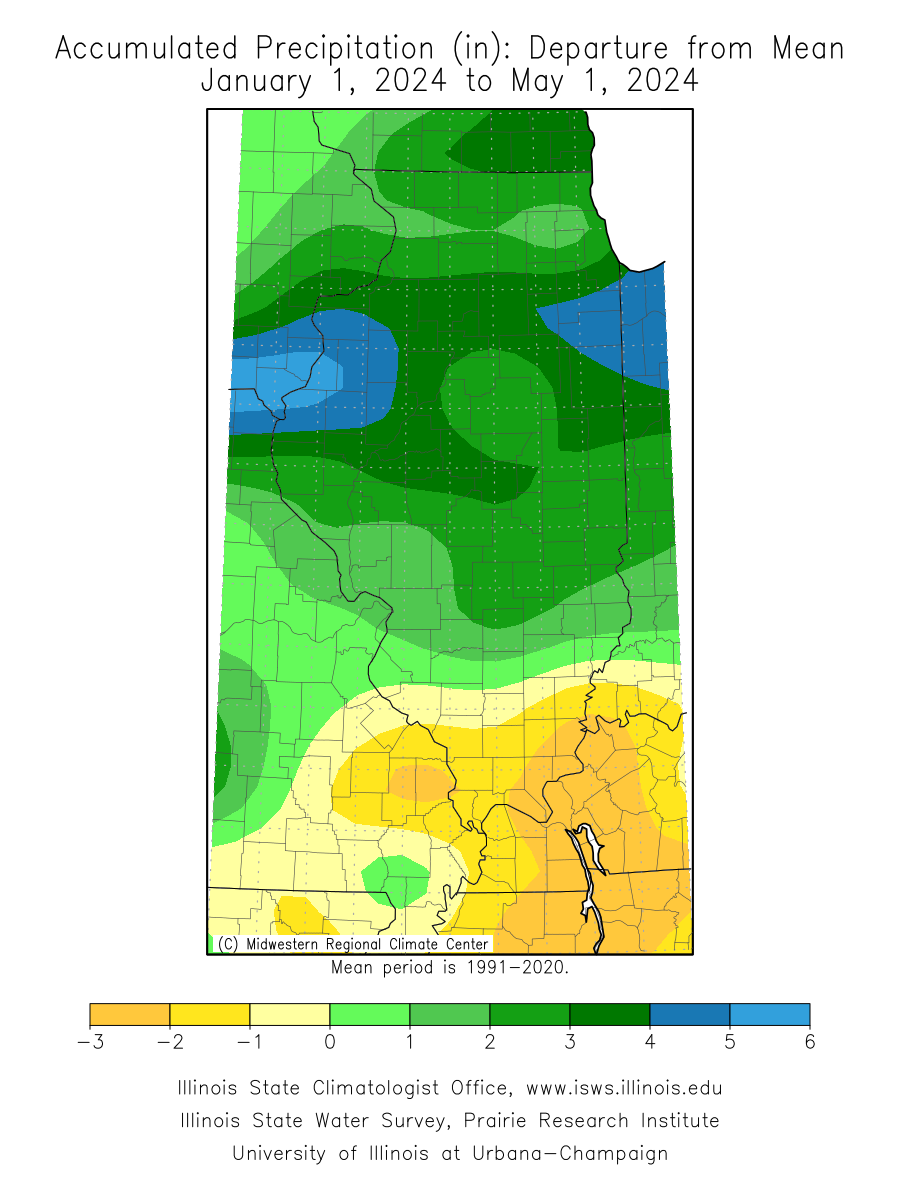 | 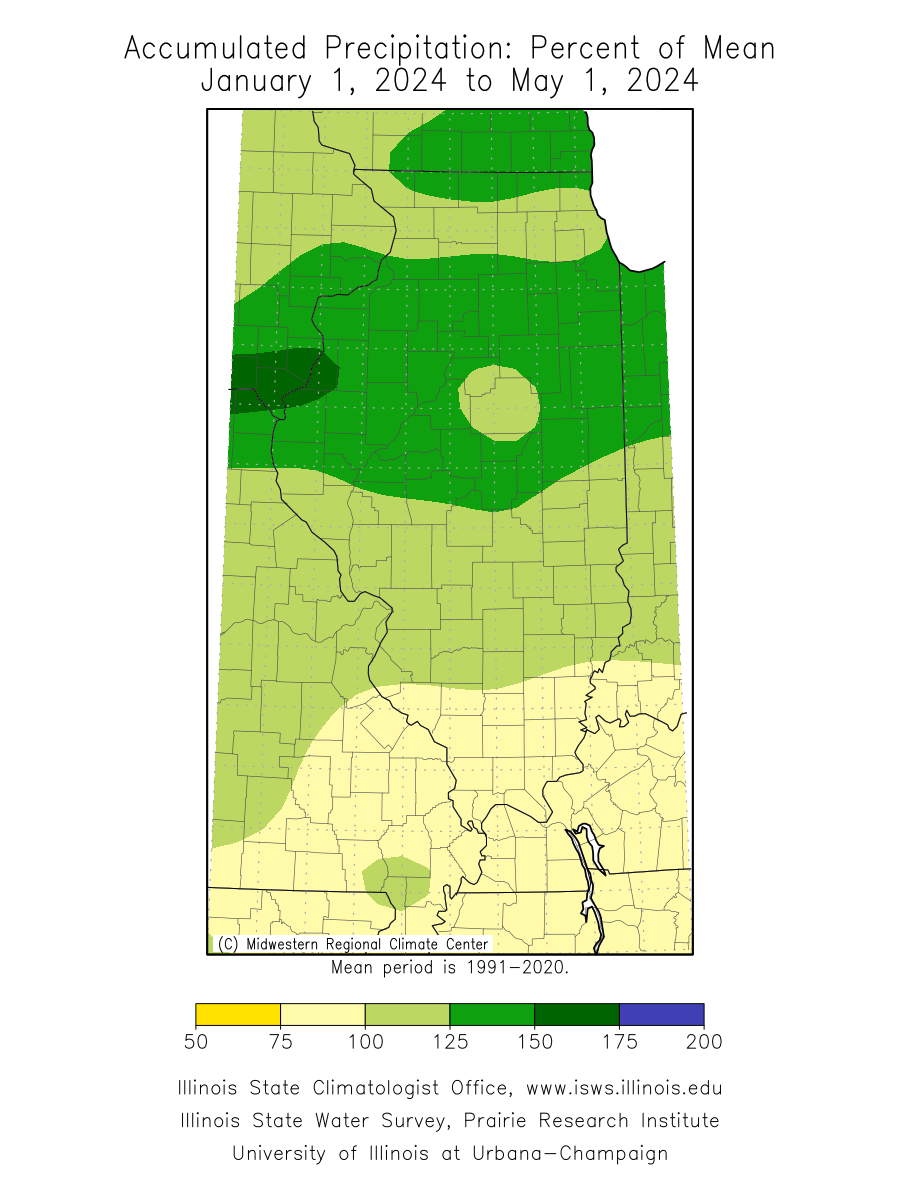 |
Average Temperature
| Temperature (°F) | Departure from Average (°F) |
| Last 7 Days | 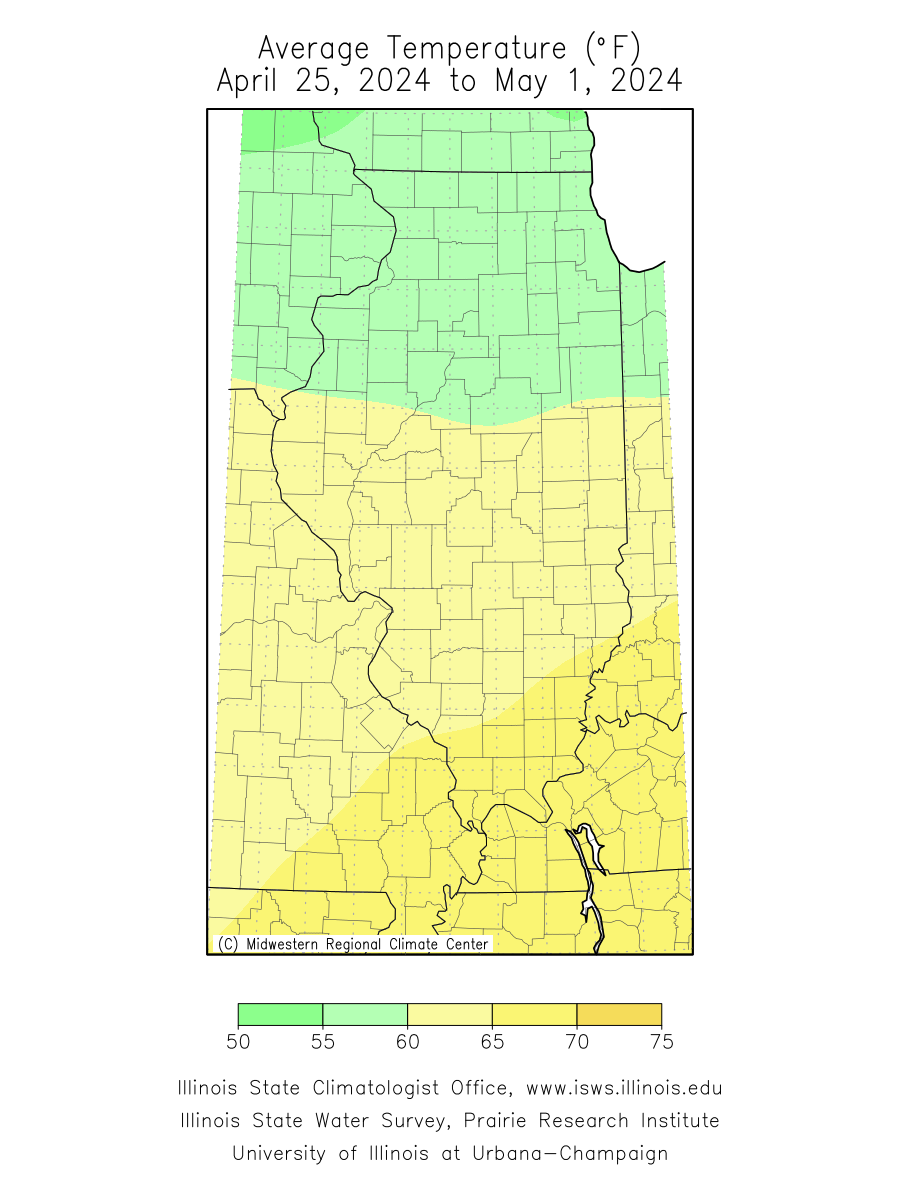 | 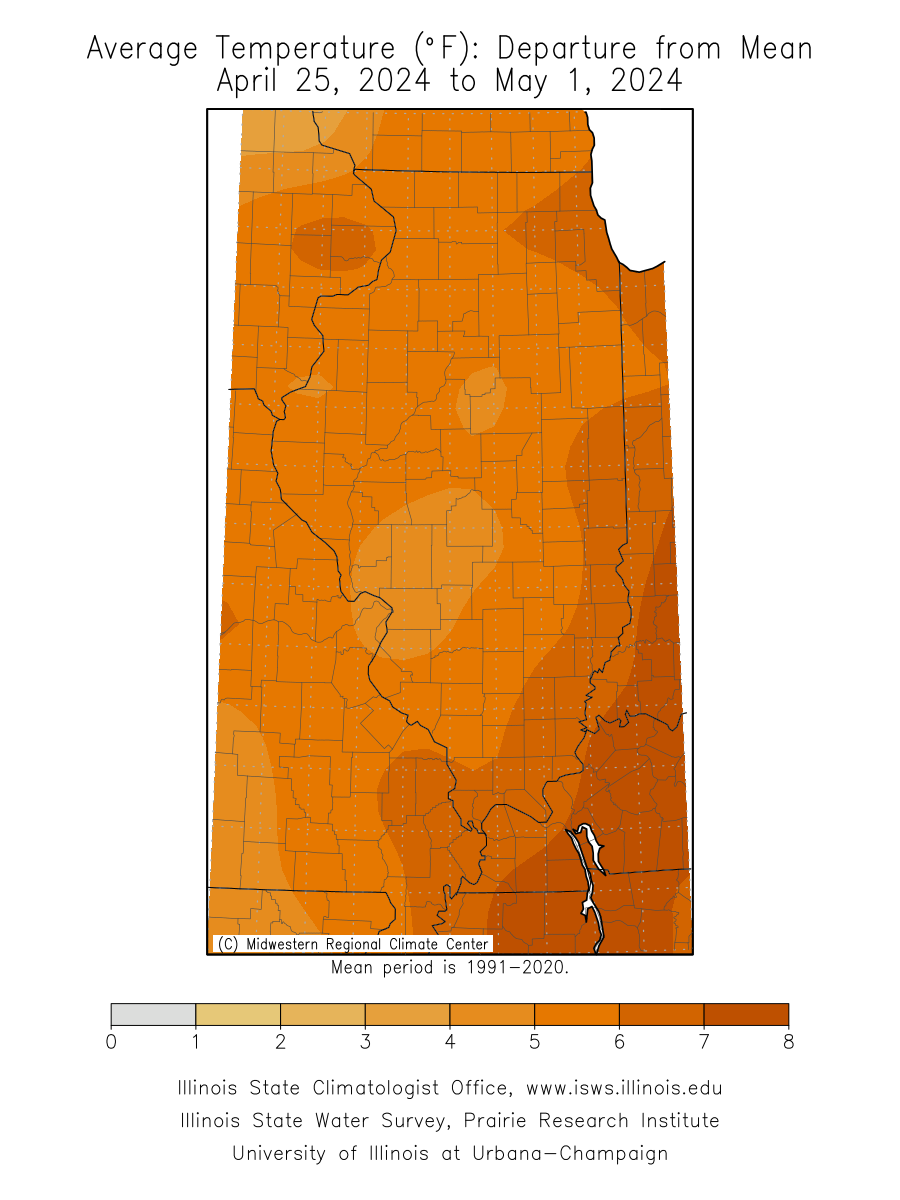 |
| Last 30 Days | 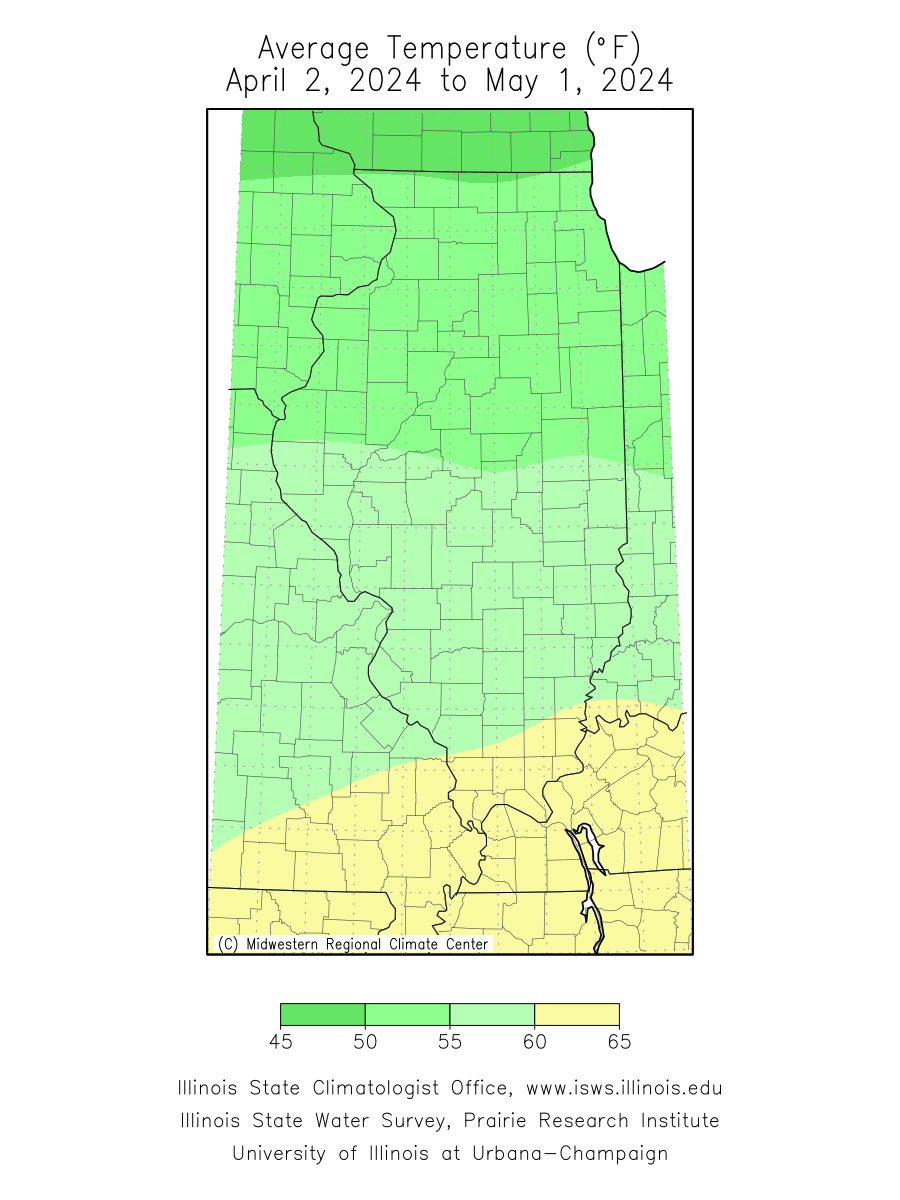 | 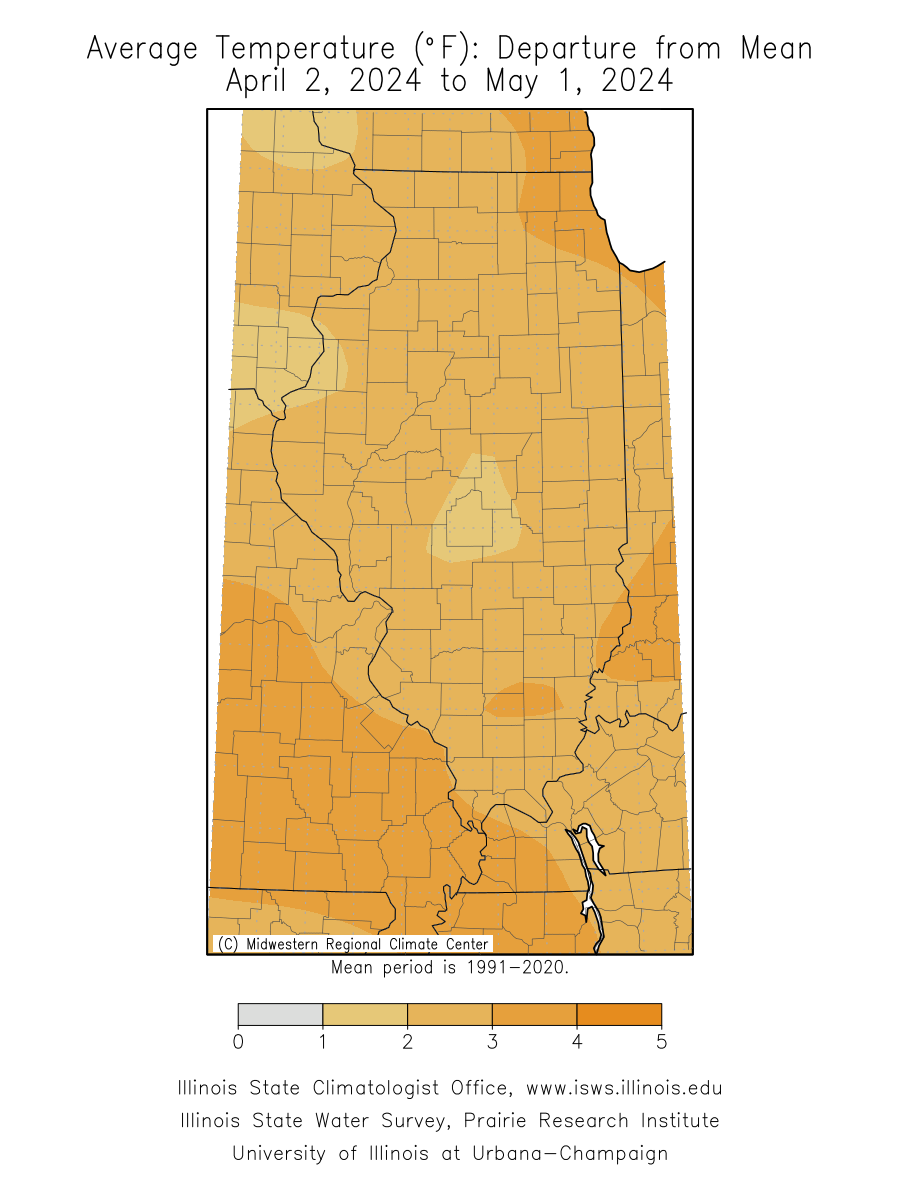 |
| Last 90 Days | 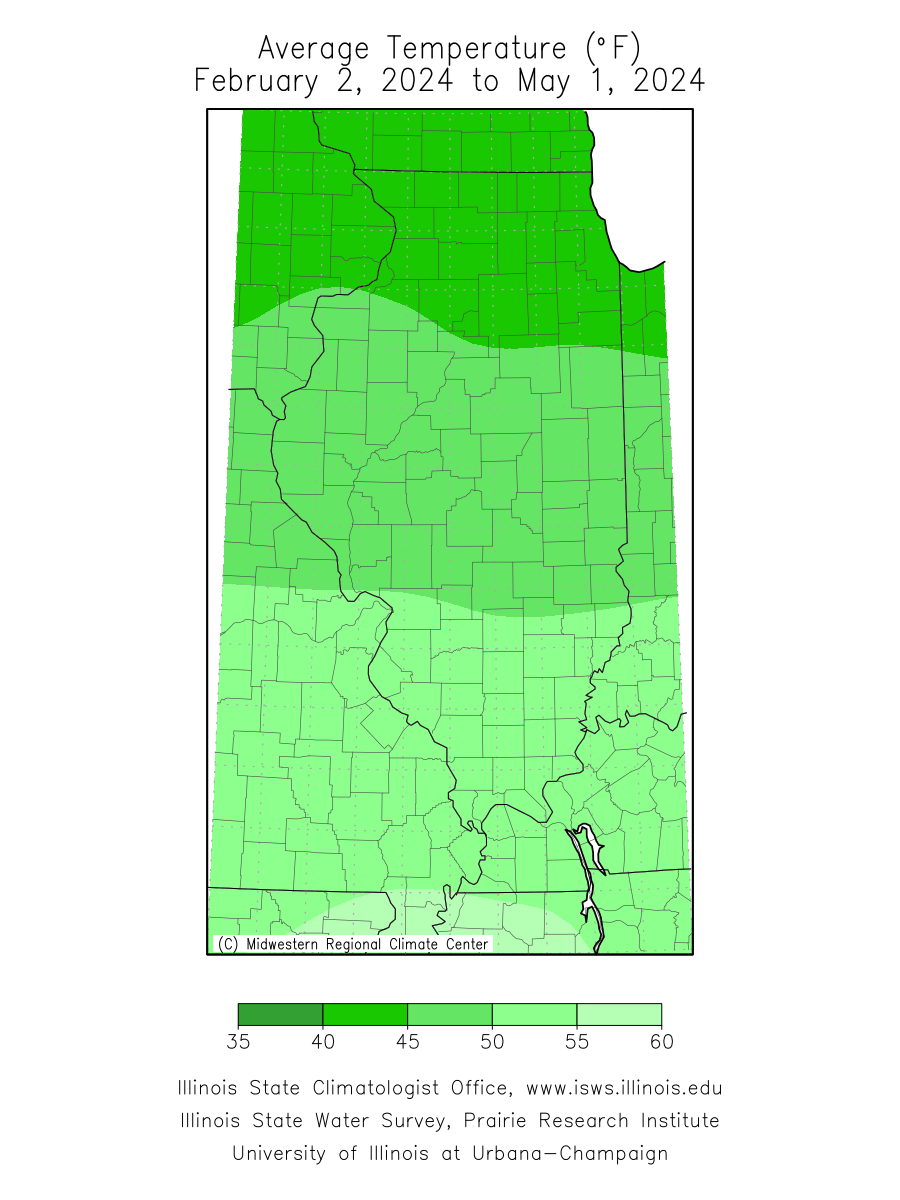 | 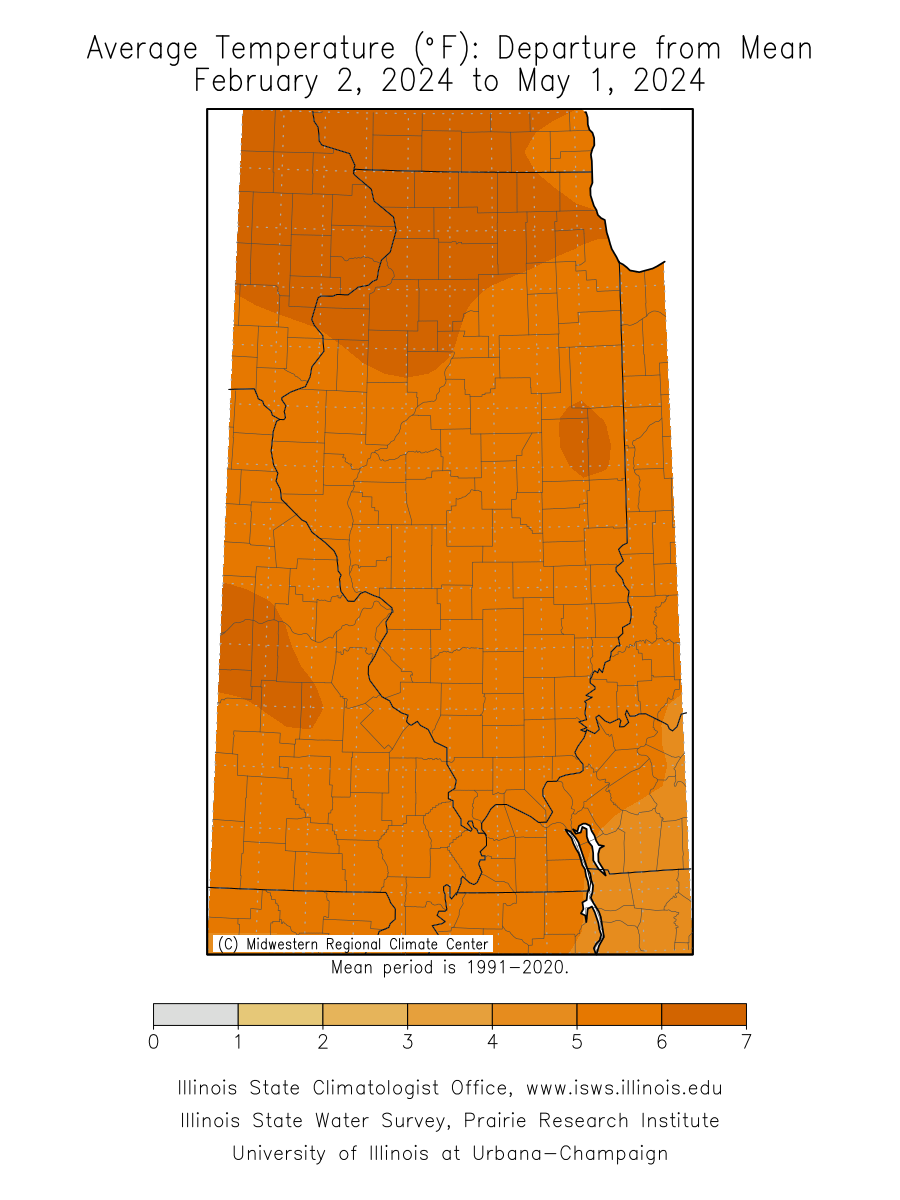 |
| Month to Date | 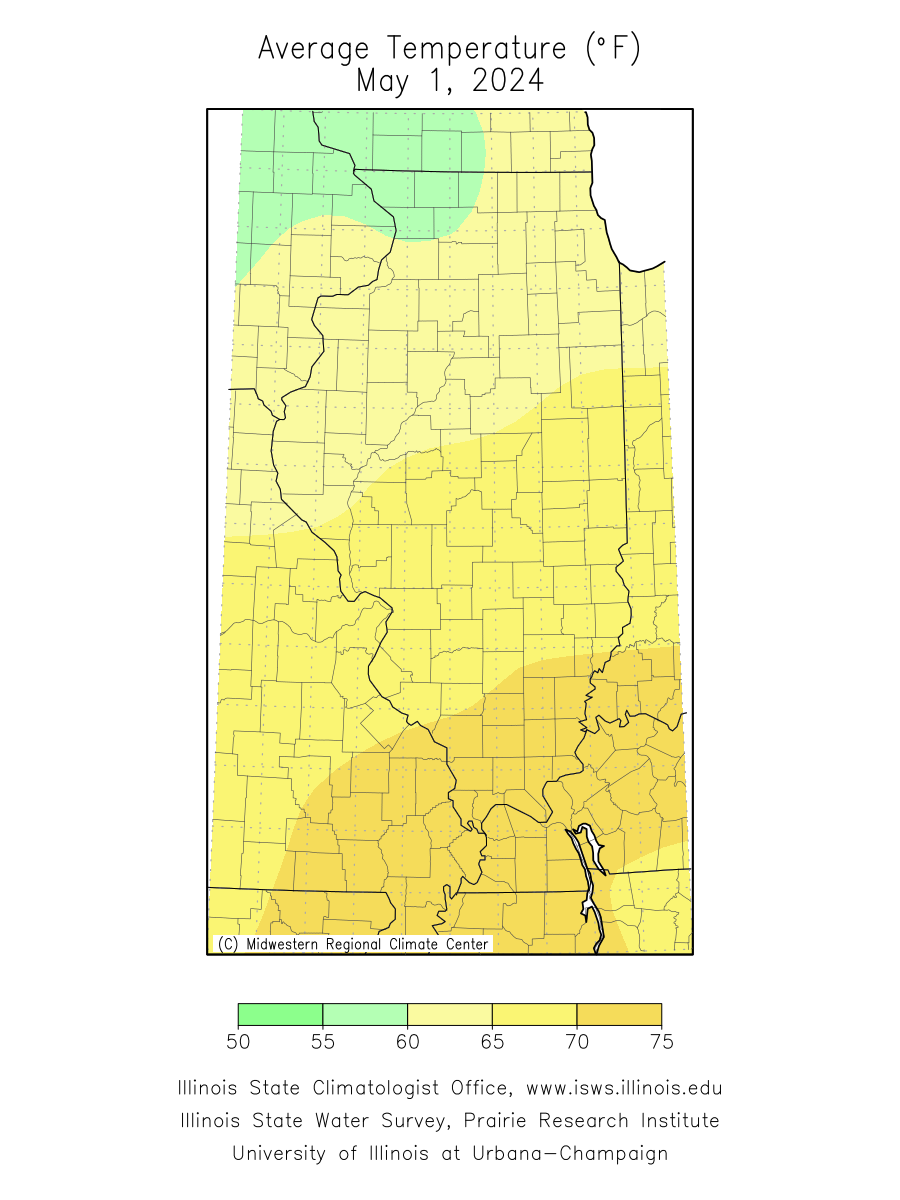 | 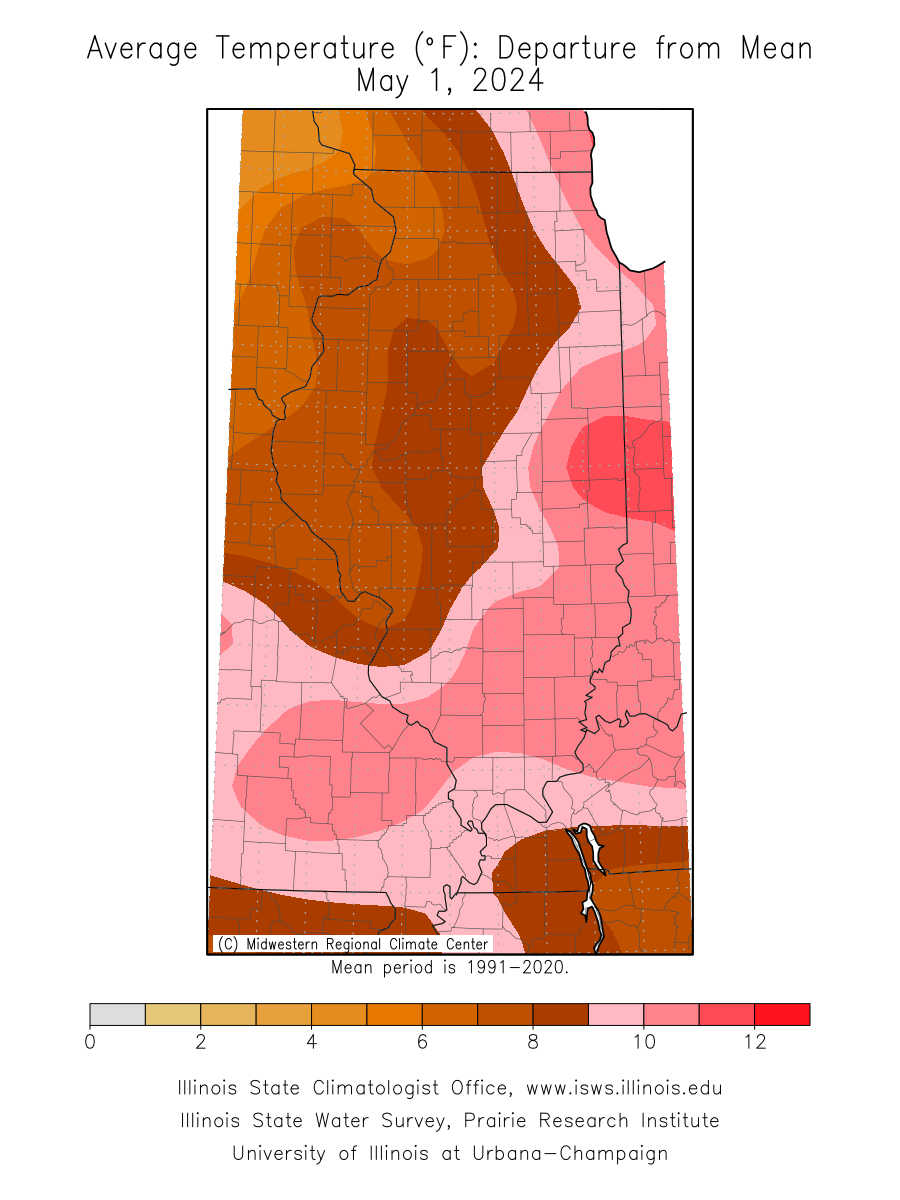 |
| Year to Date | 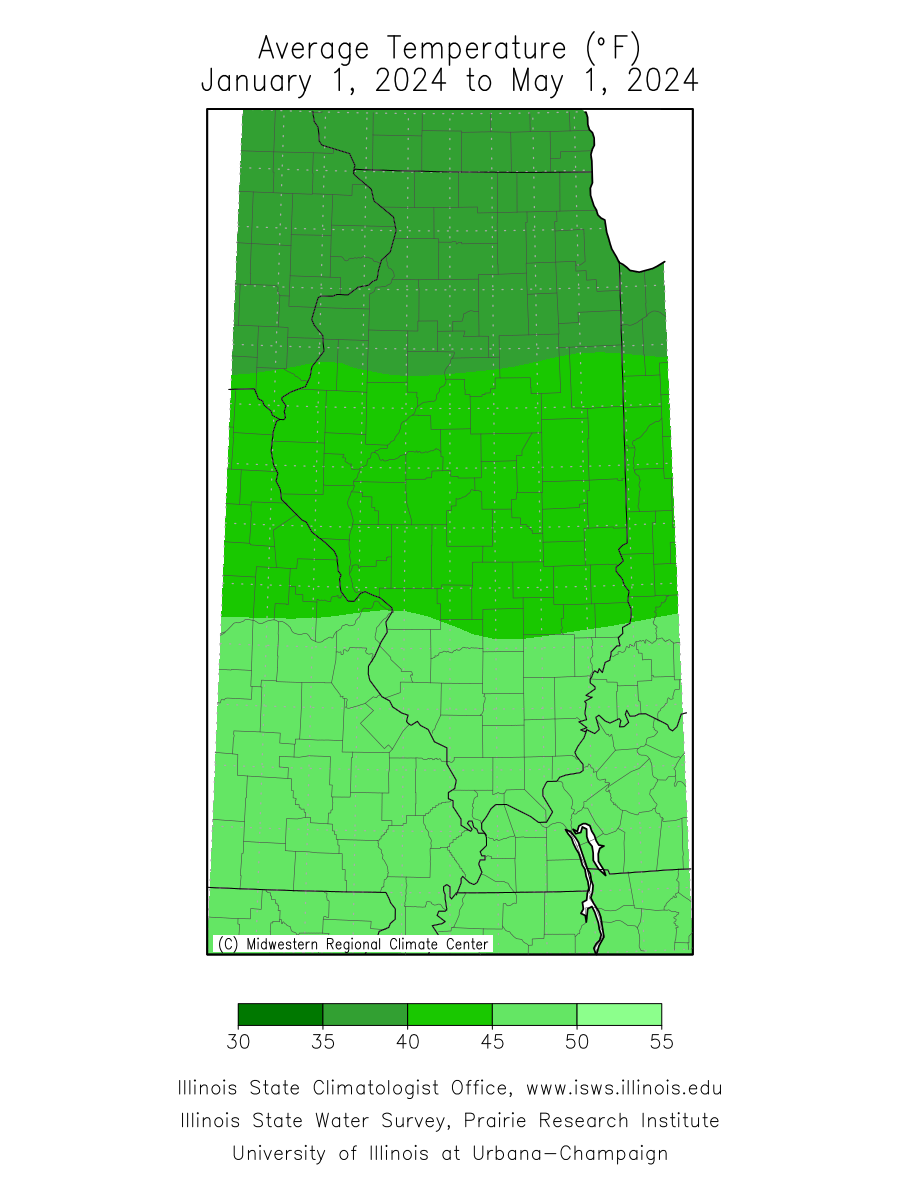 | 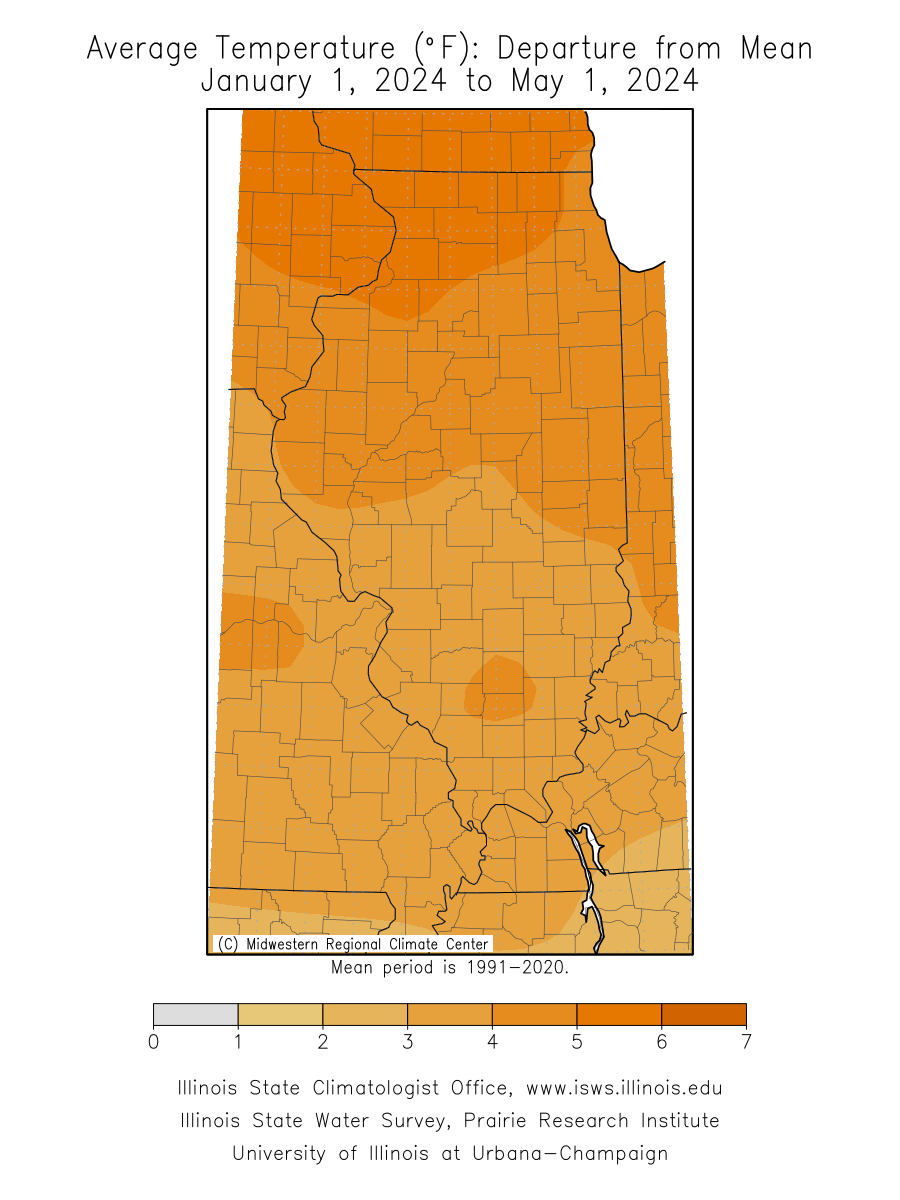 |
Maximum Temperature
| Temperature (°F) | Departure from Average (°F) |
| Last 7 Days | 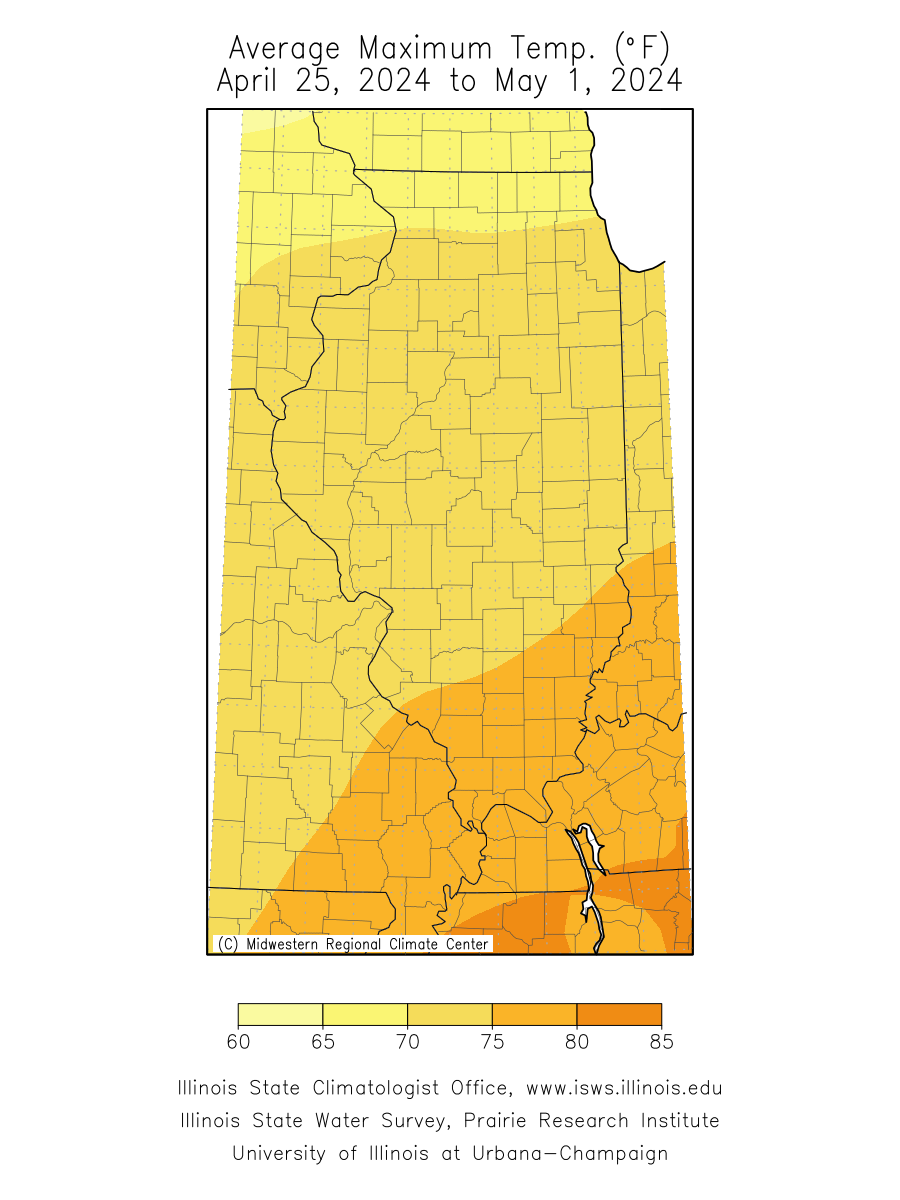 | 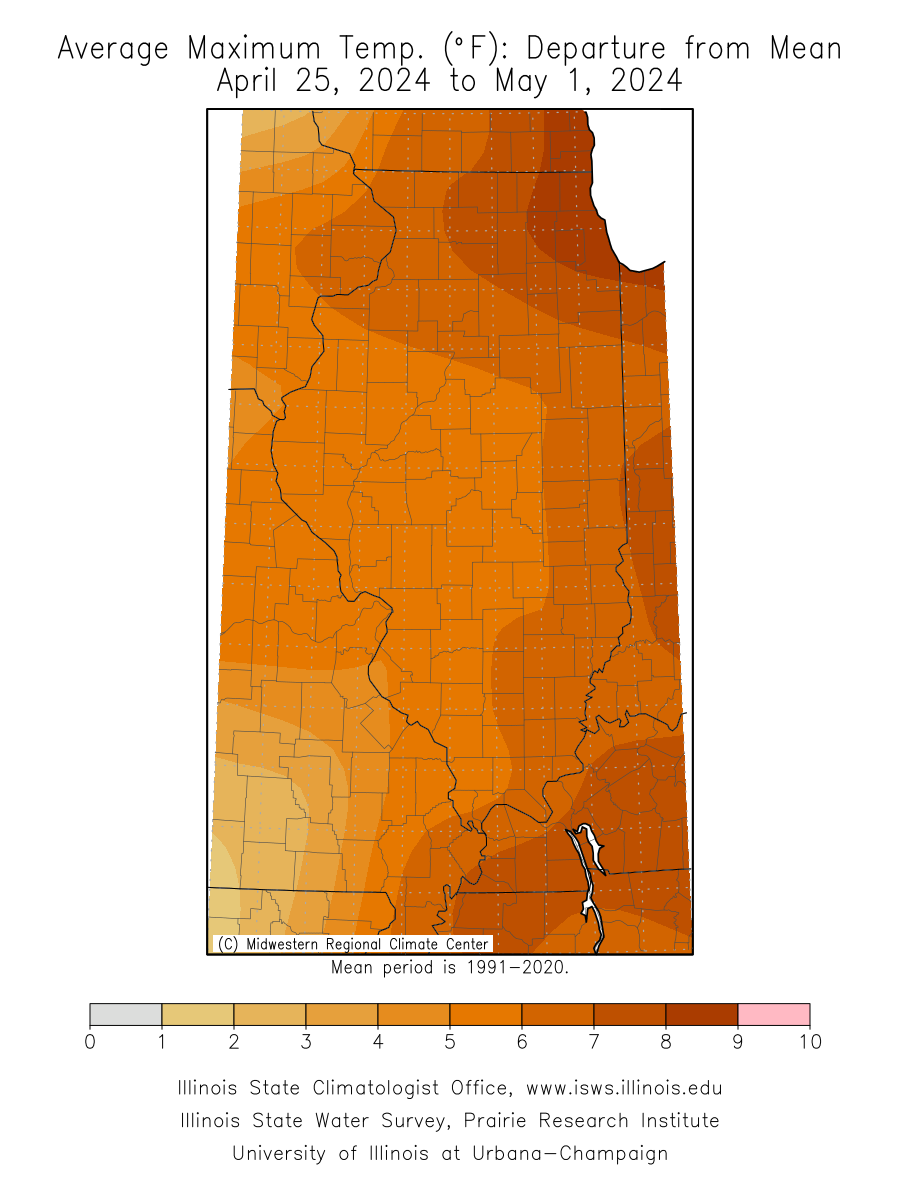 |
| Last 30 Days | 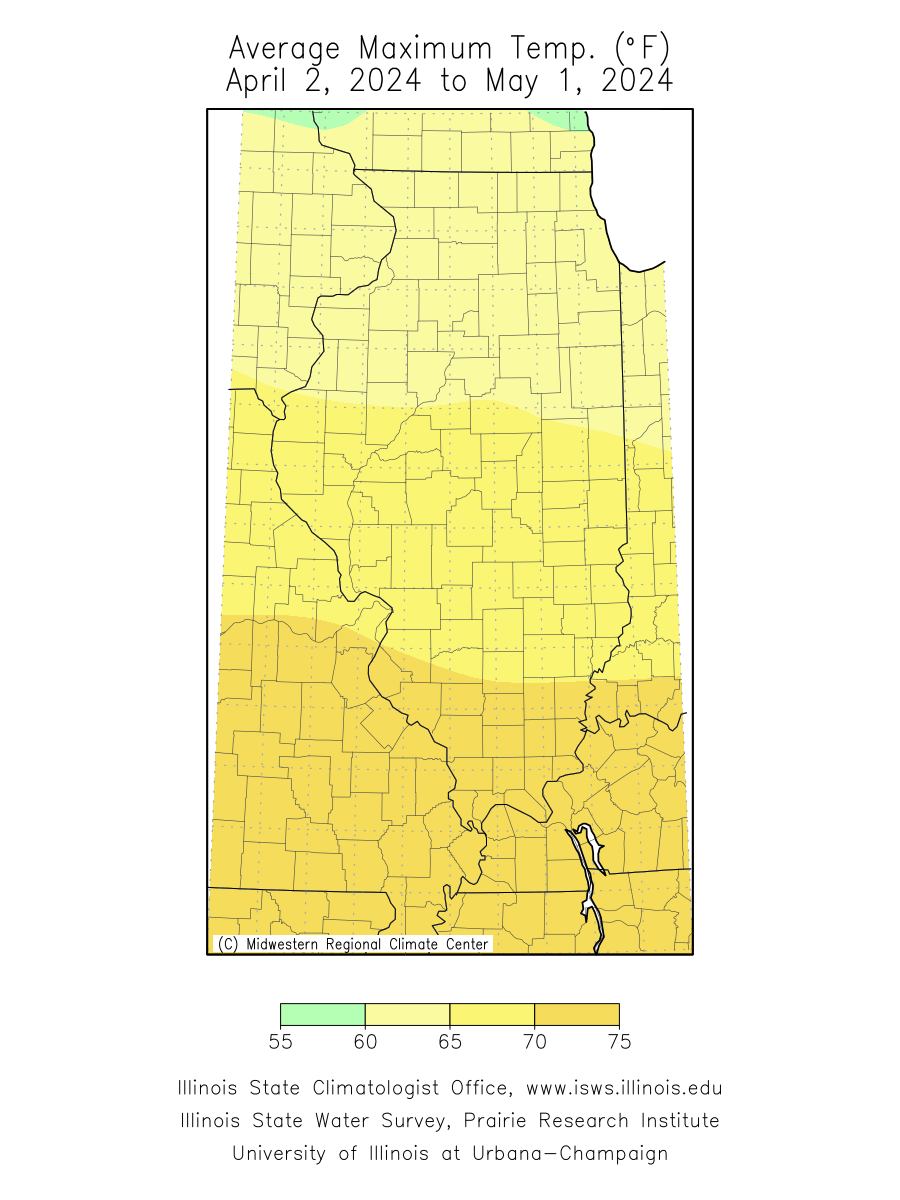 | 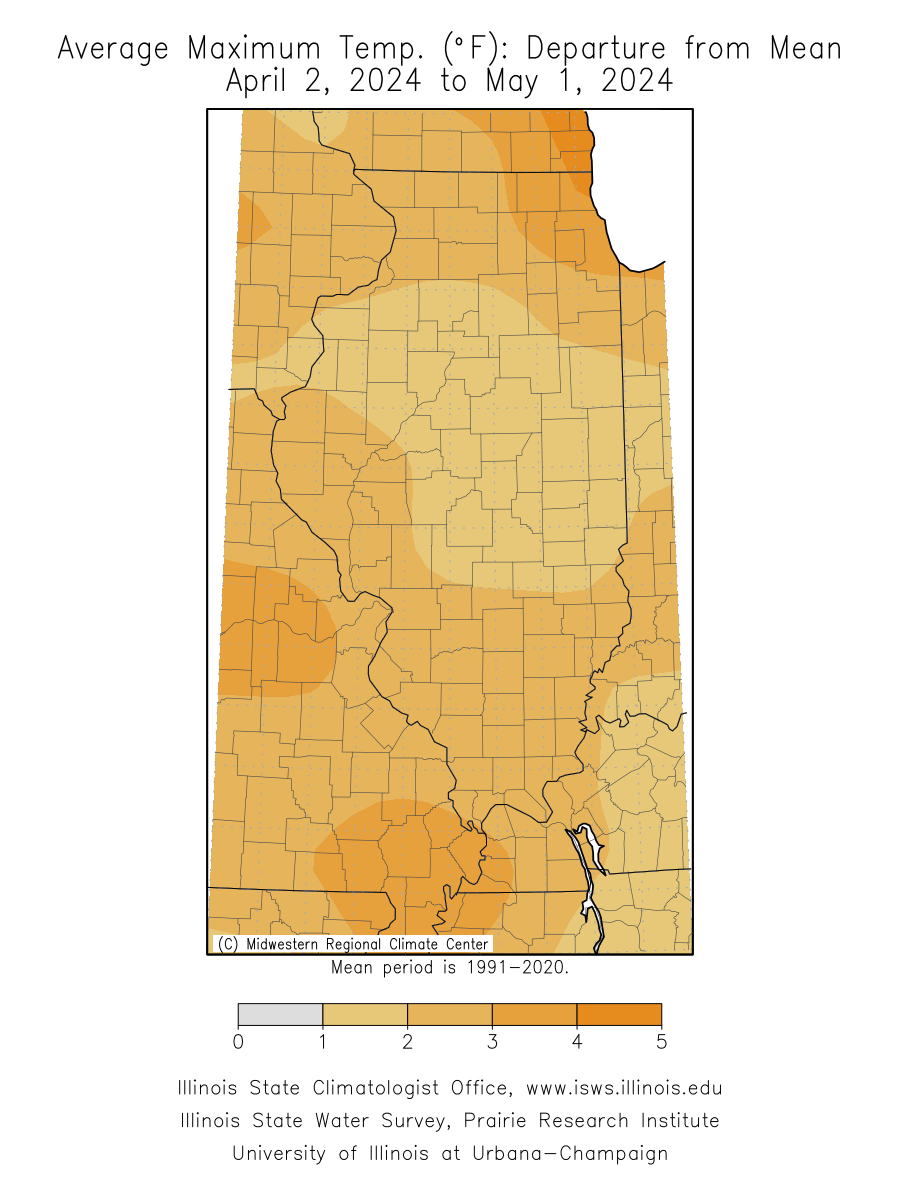 |
| Last 90 Days | 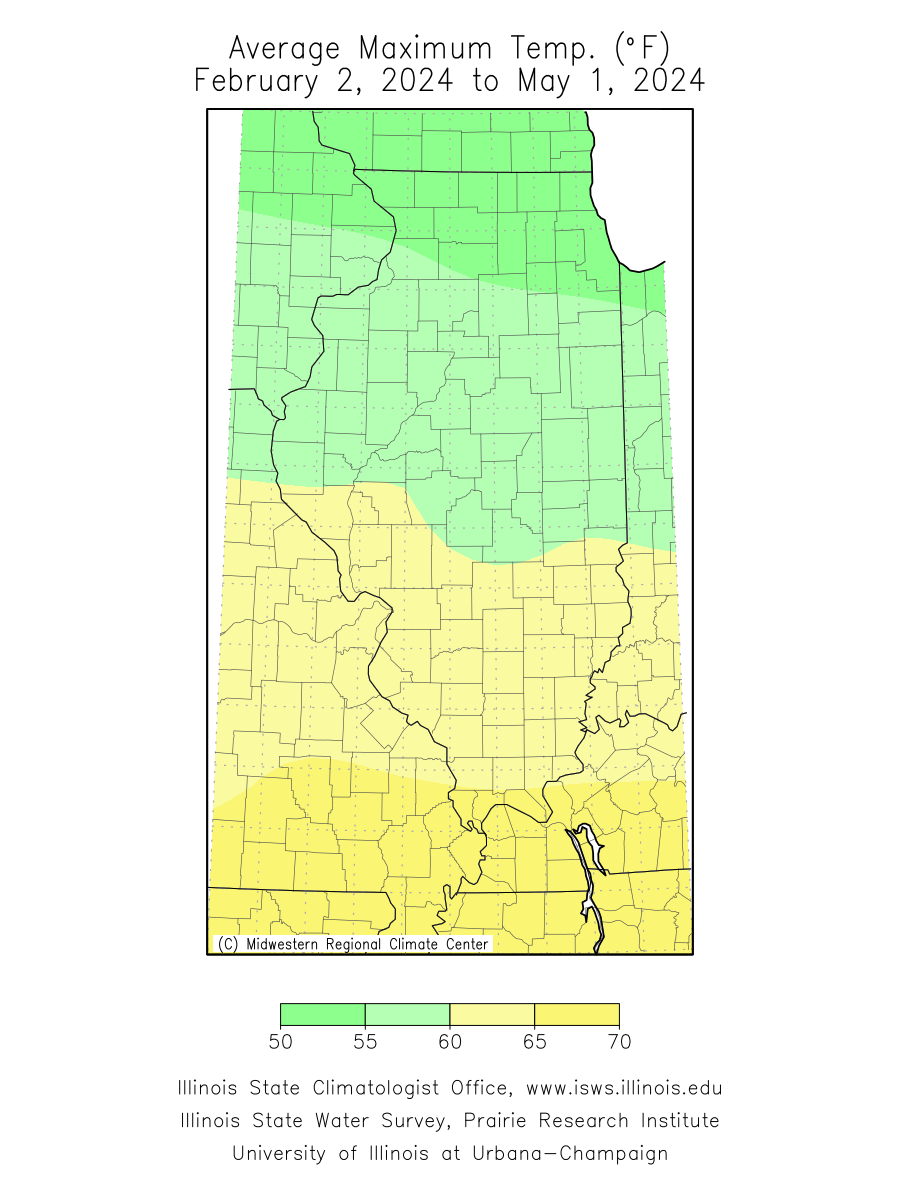 | 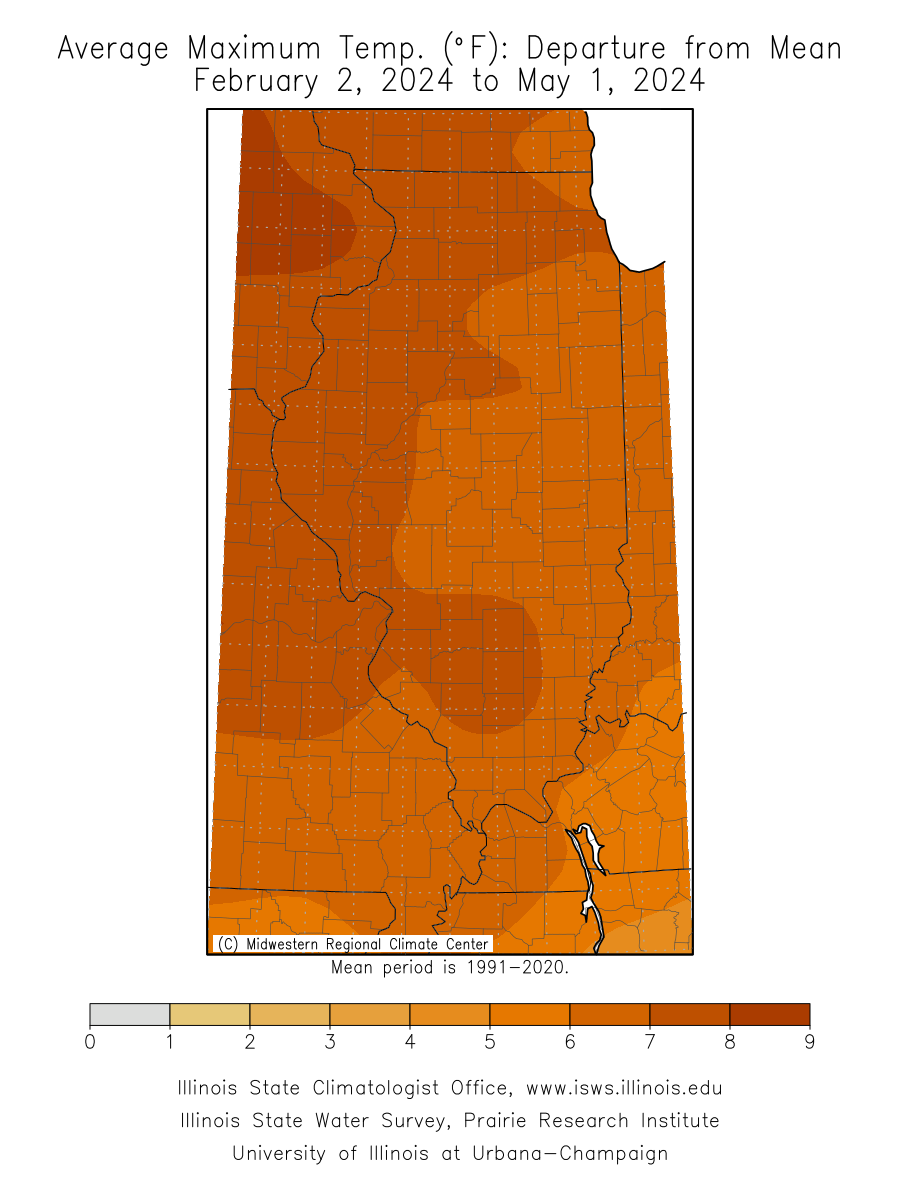 |
| Month to Date | 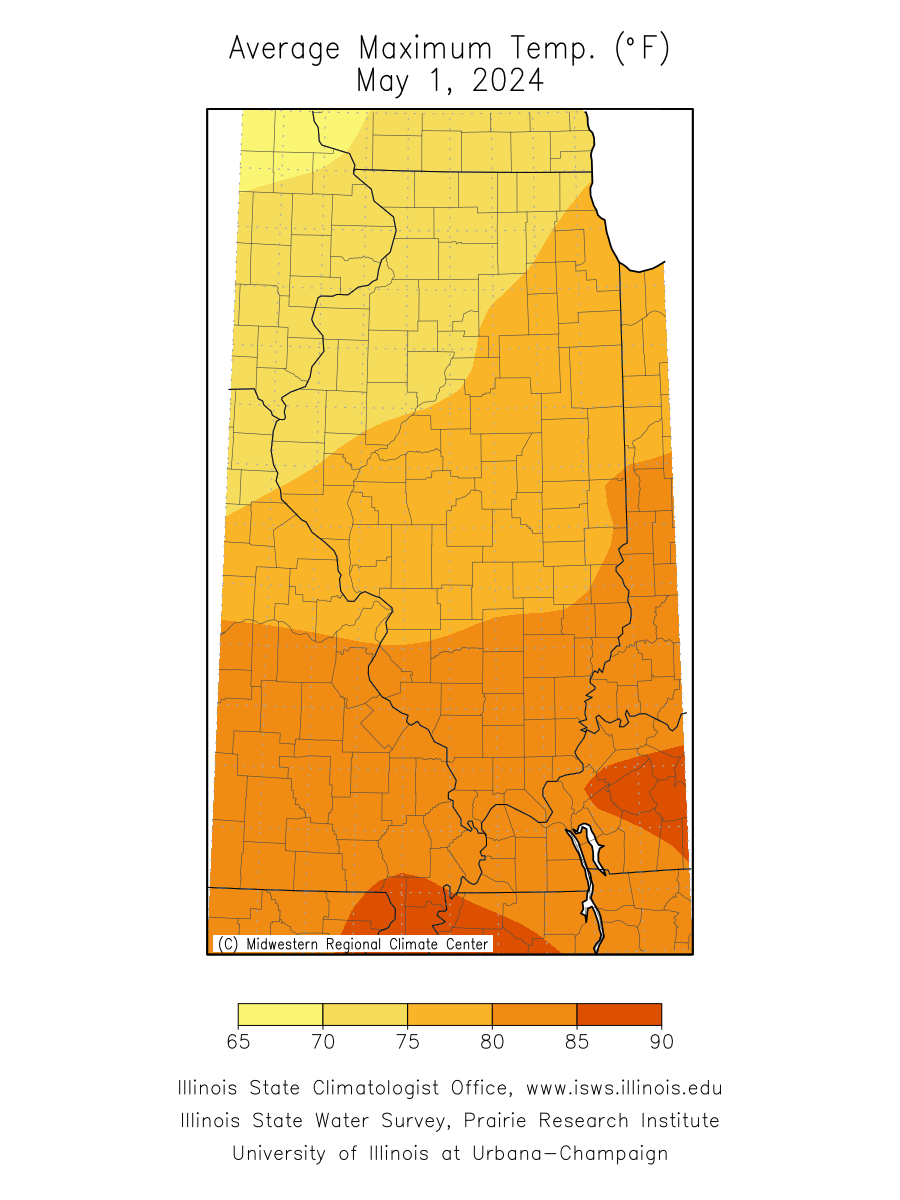 | 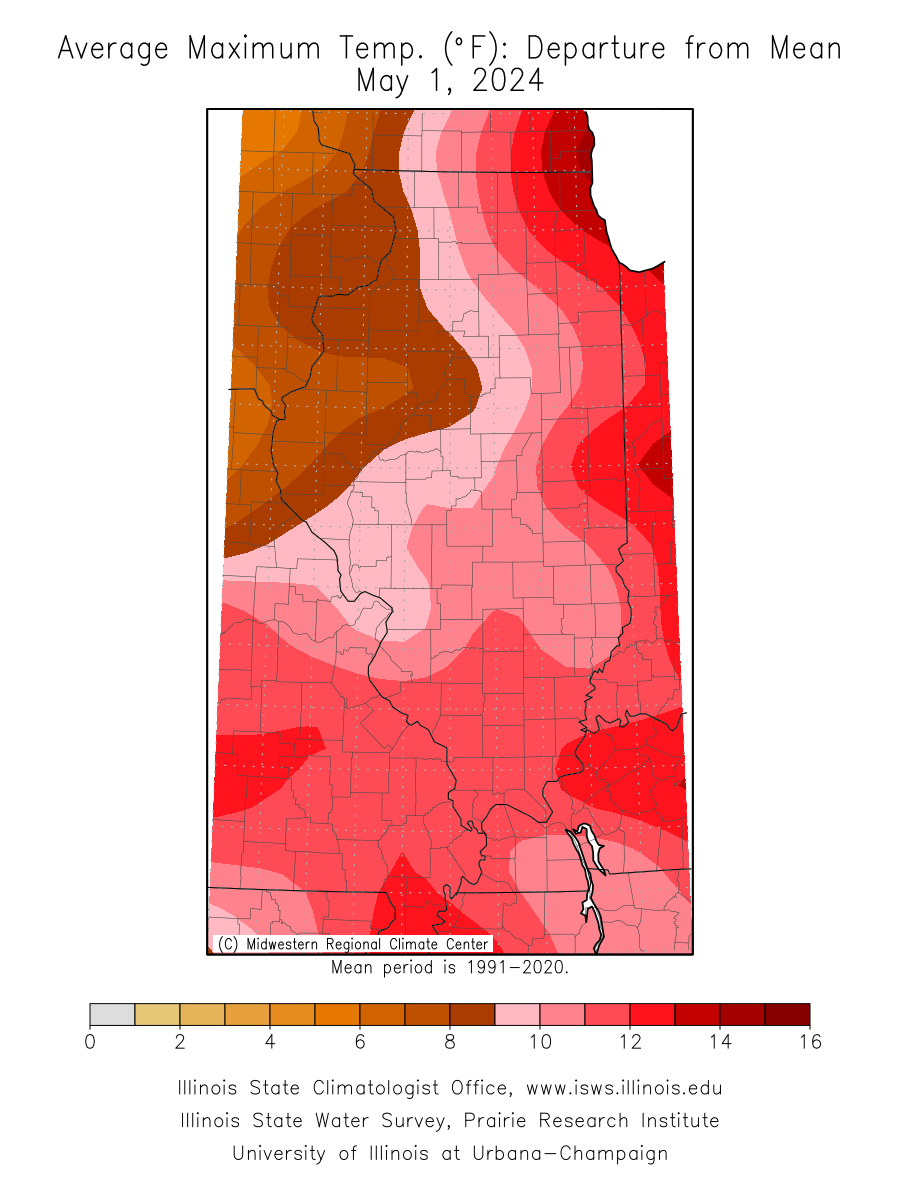 |
| Year to Date | 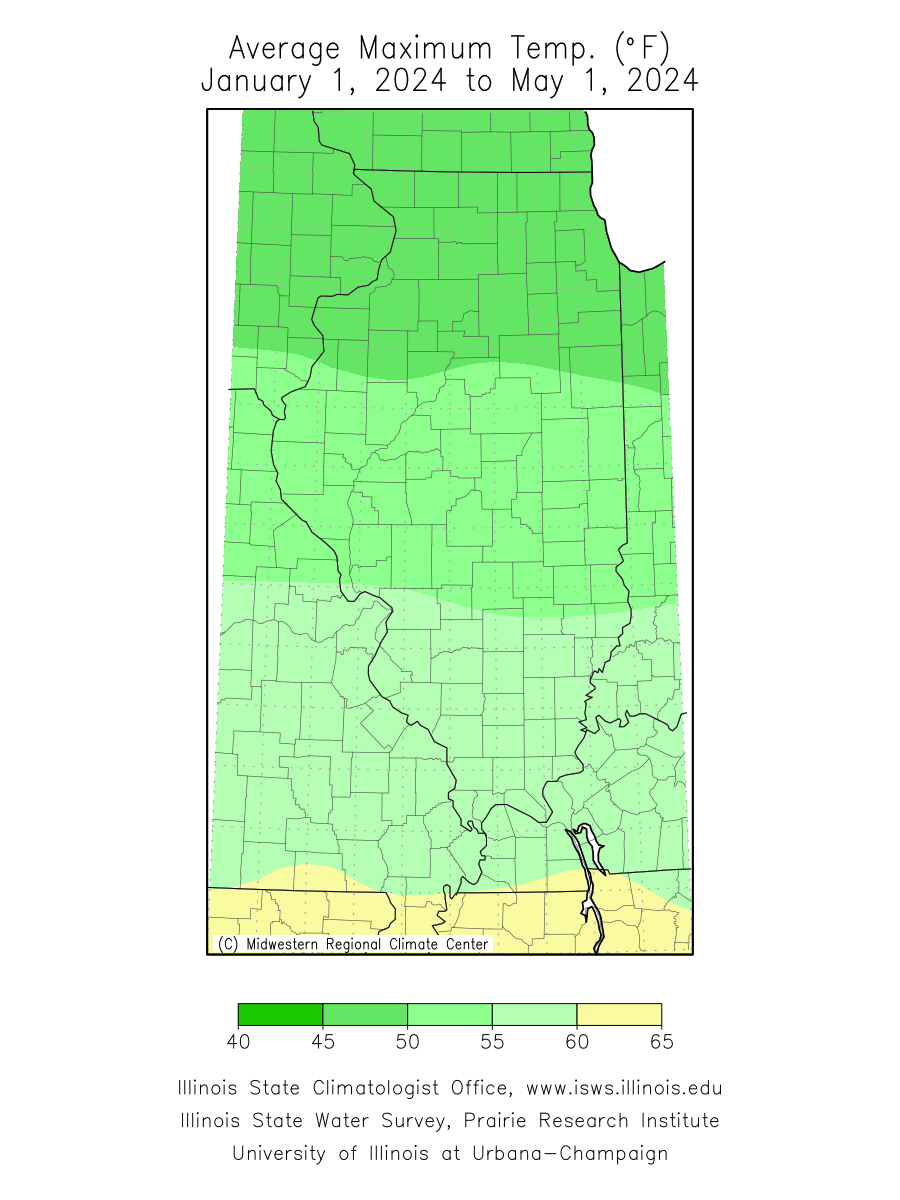 | 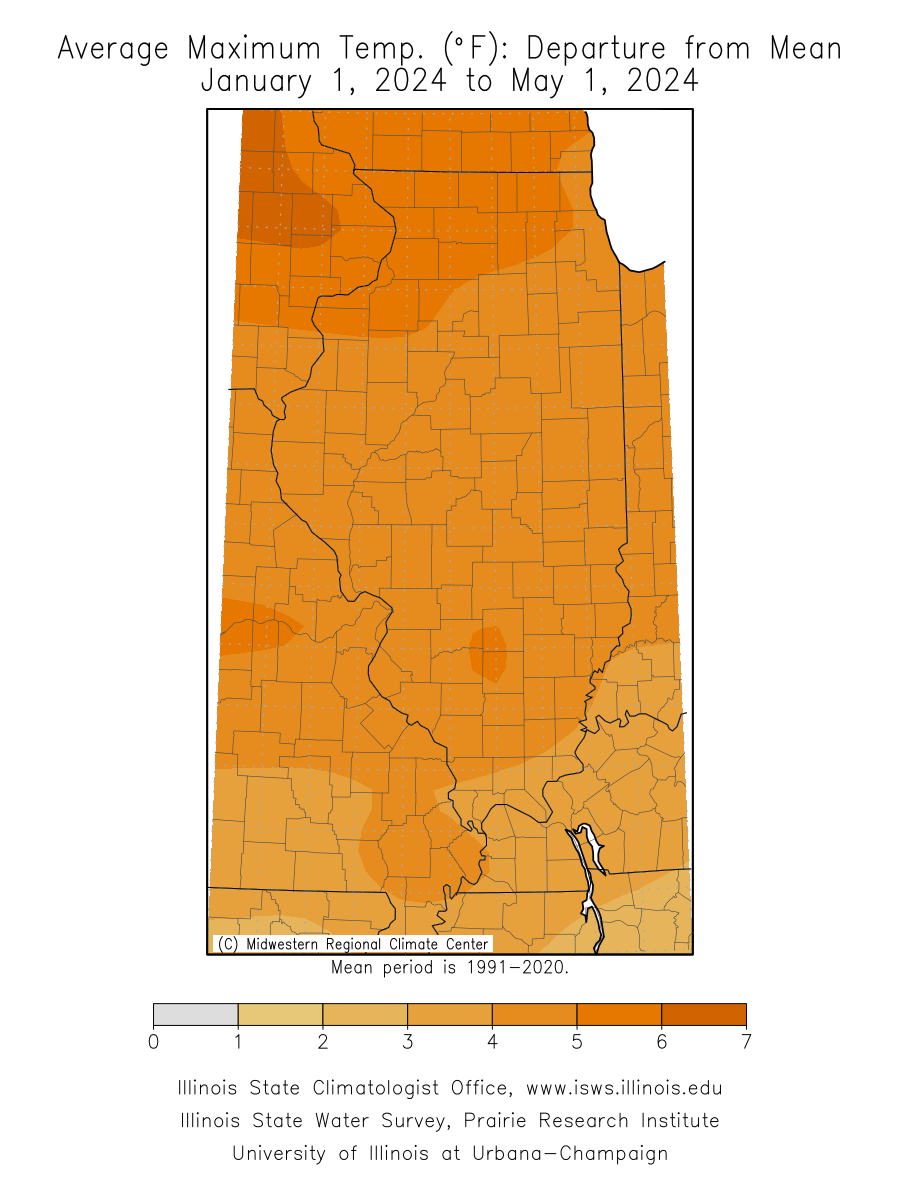 |
Minimum Temperature
| Temperature (°F) | Departure from Average (°F) |
| Last 7 Days | 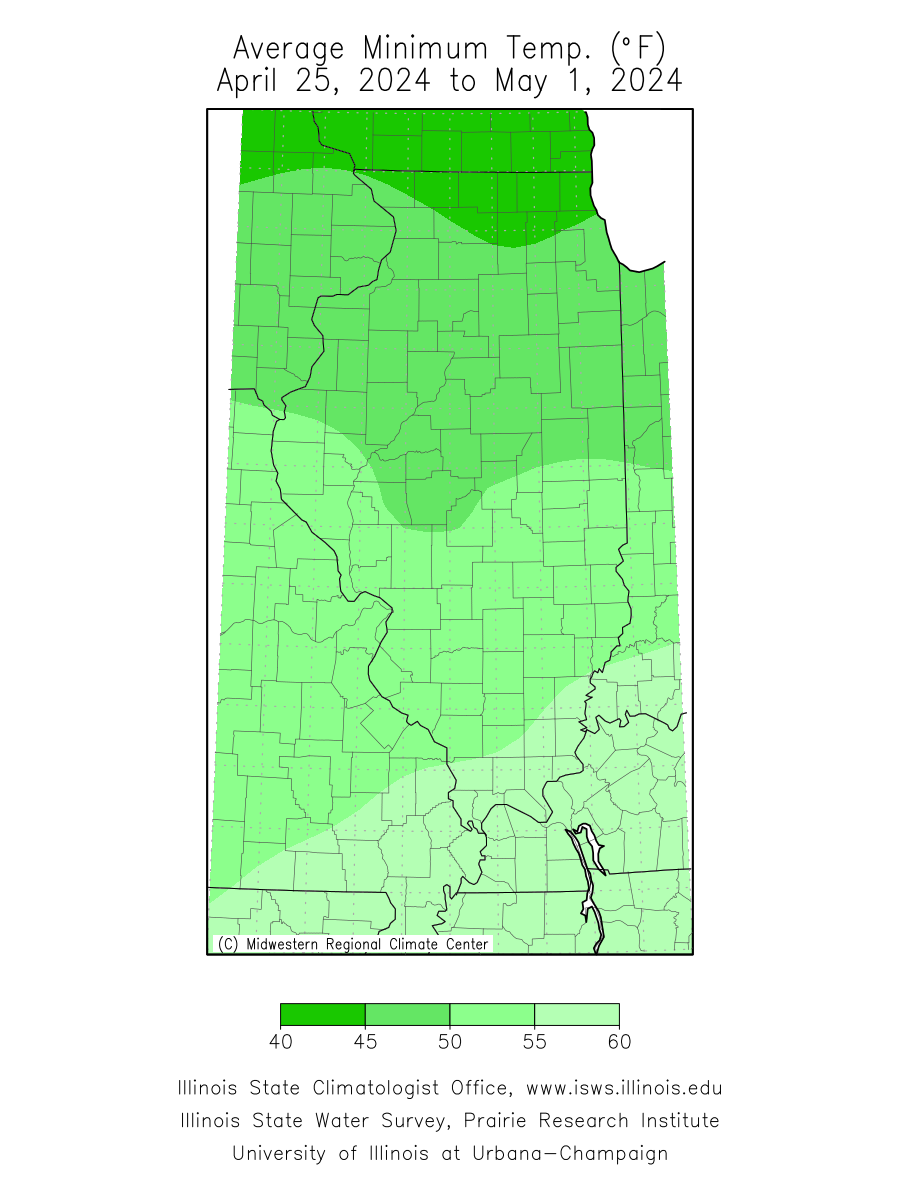 | 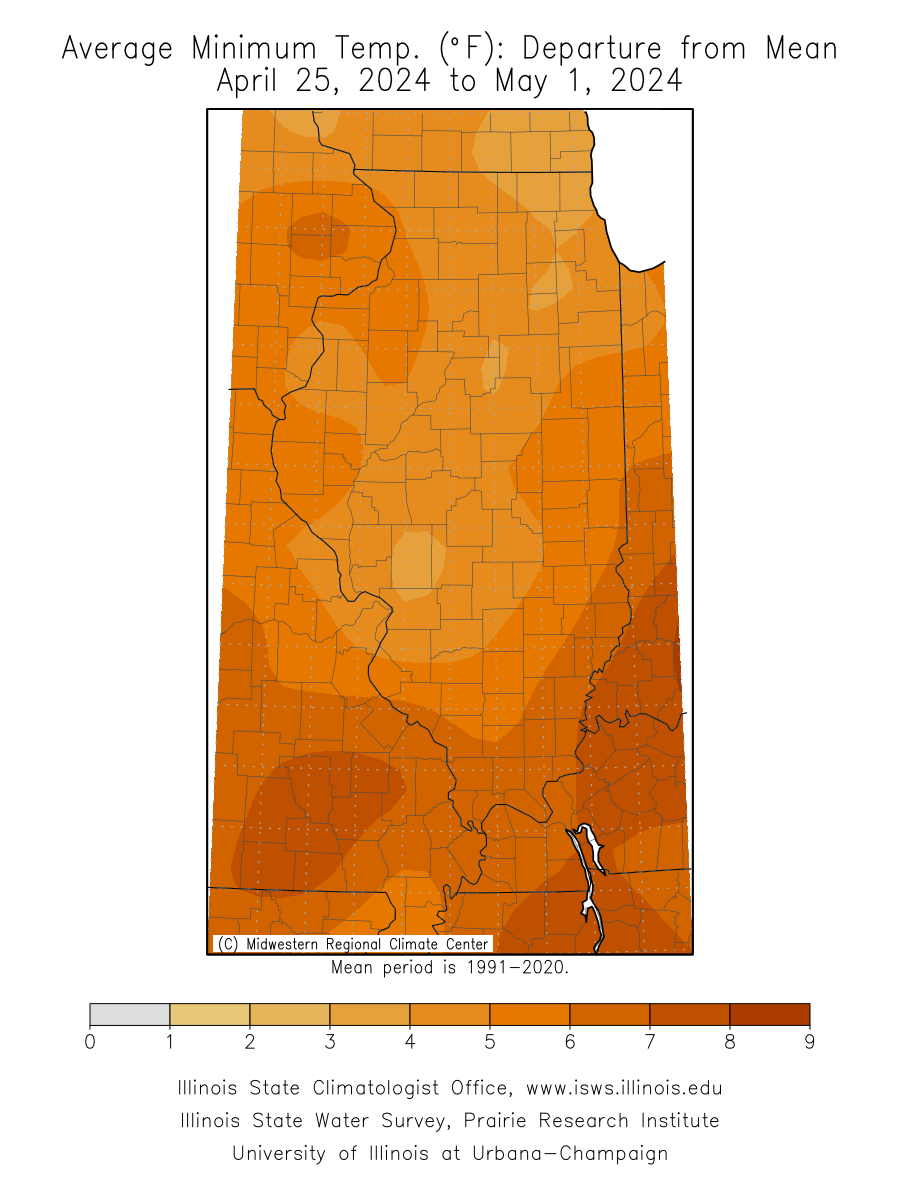 |
| Last 30 Days | 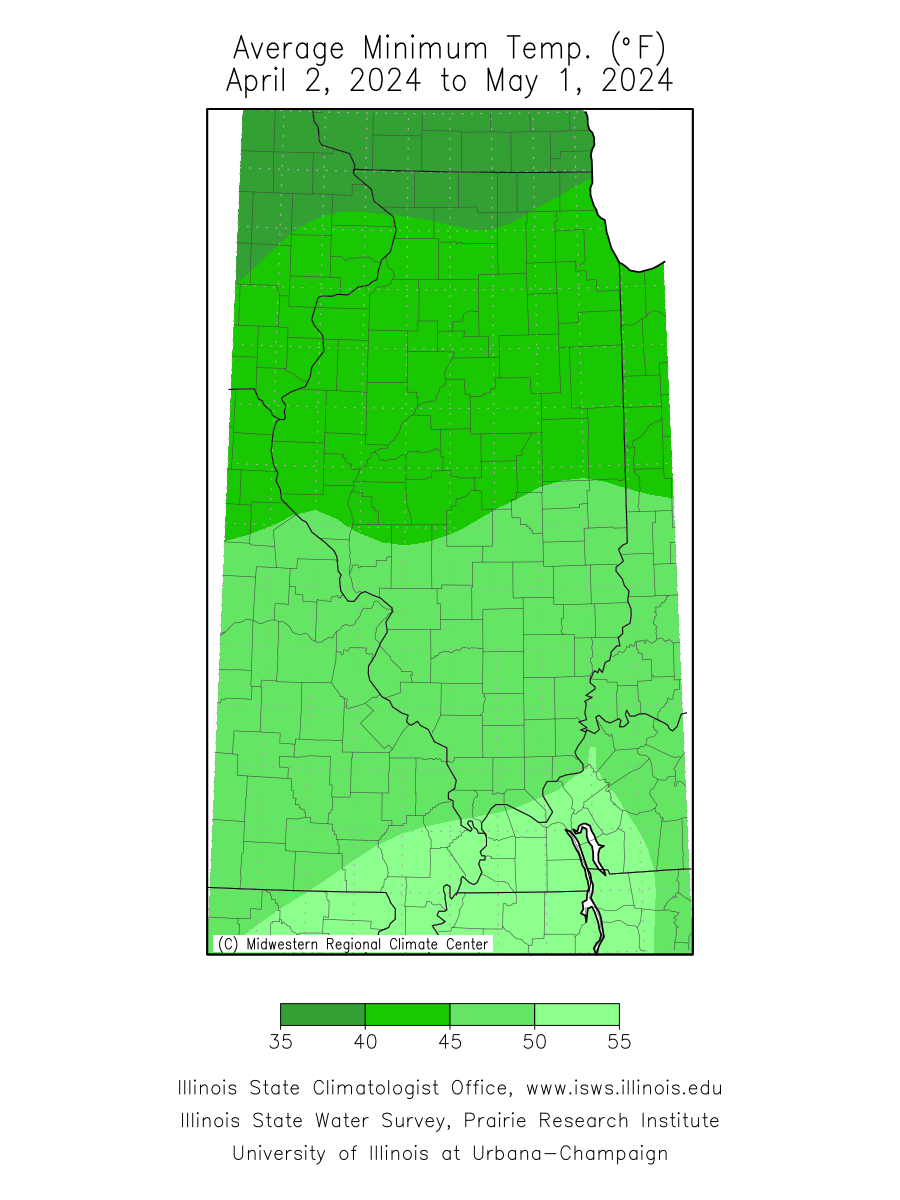 | 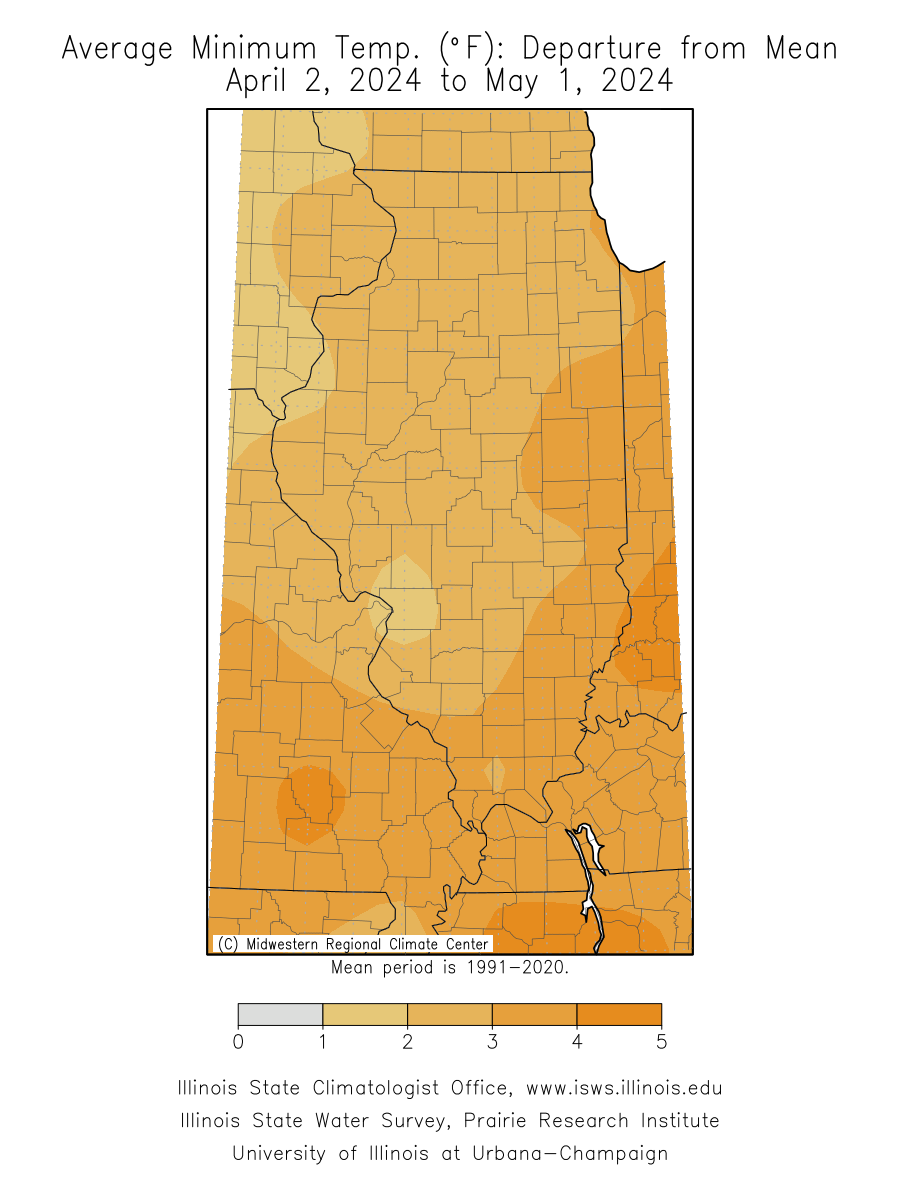 |
| Last 90 Days | 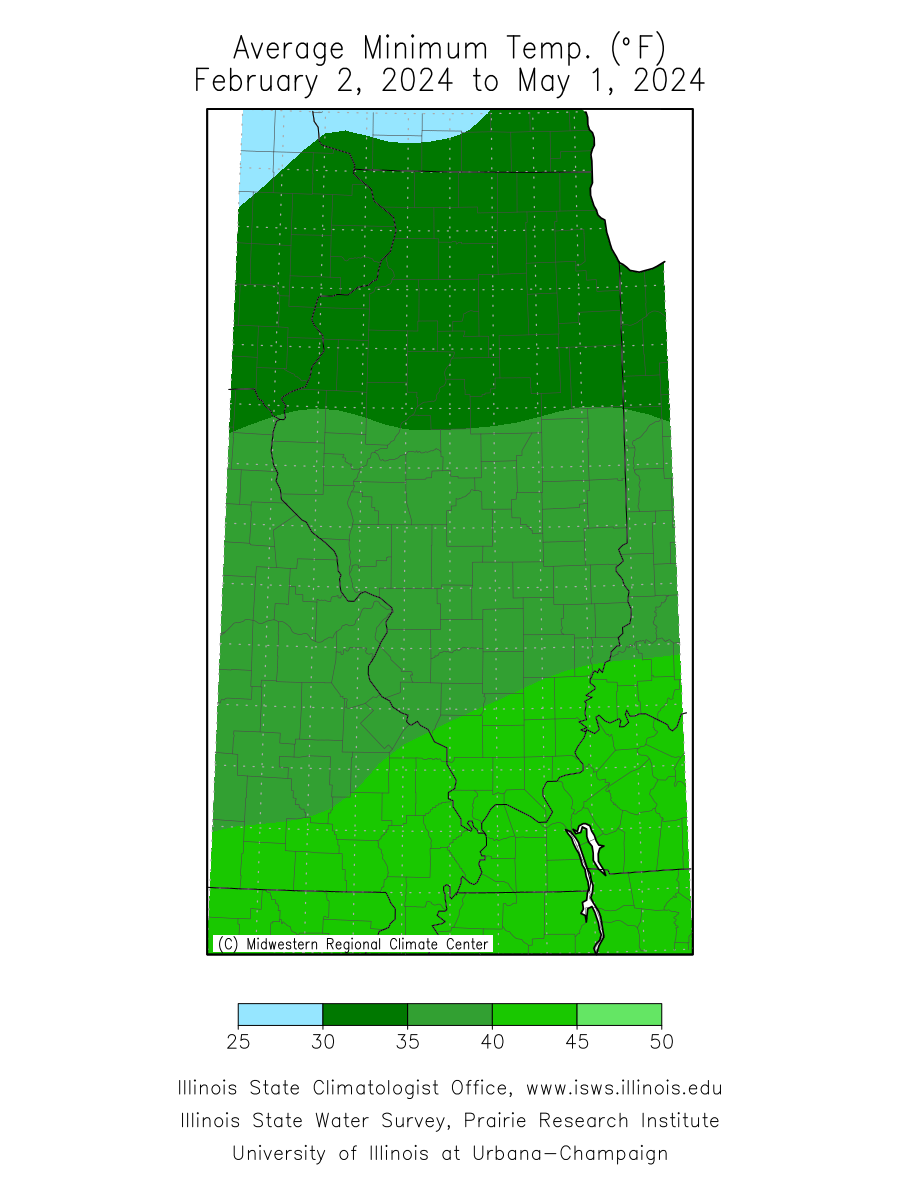 | 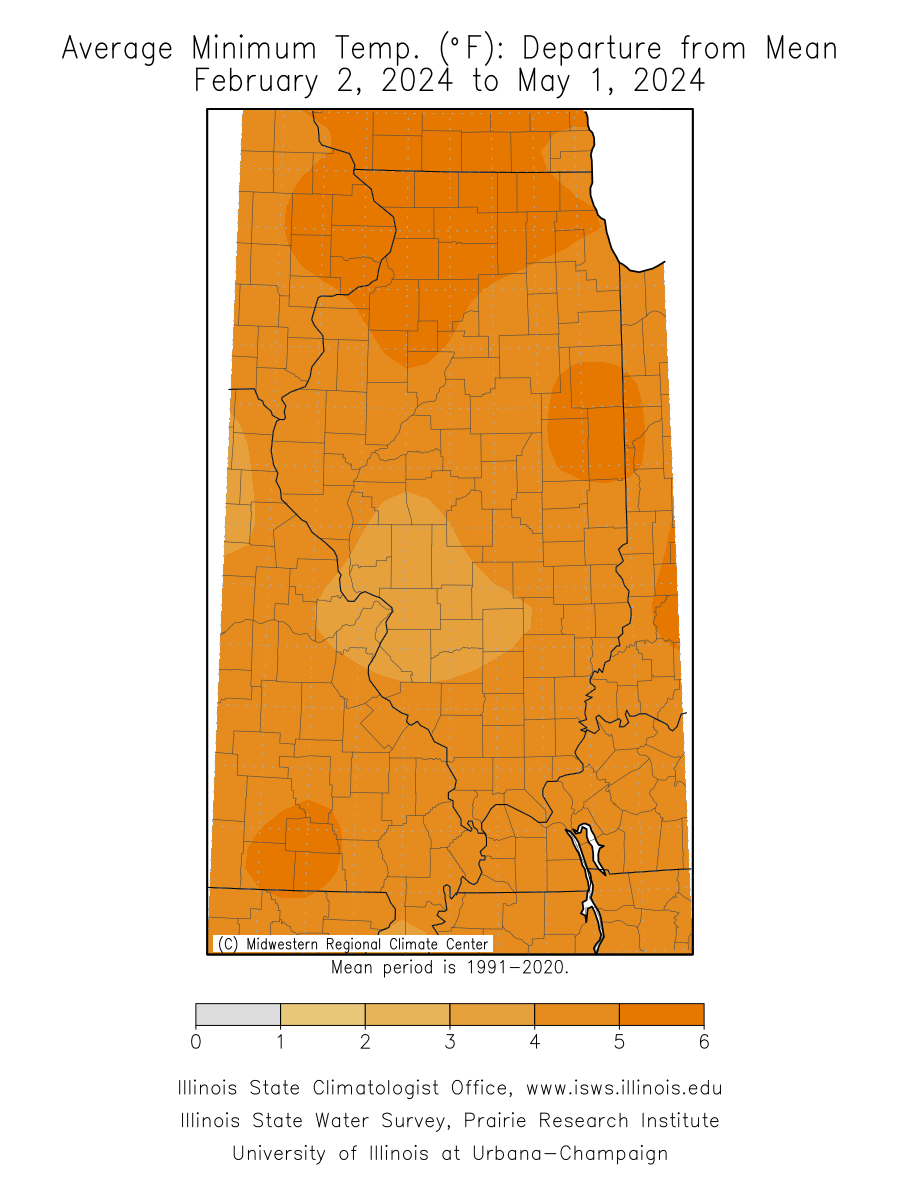 |
| Month to Date | 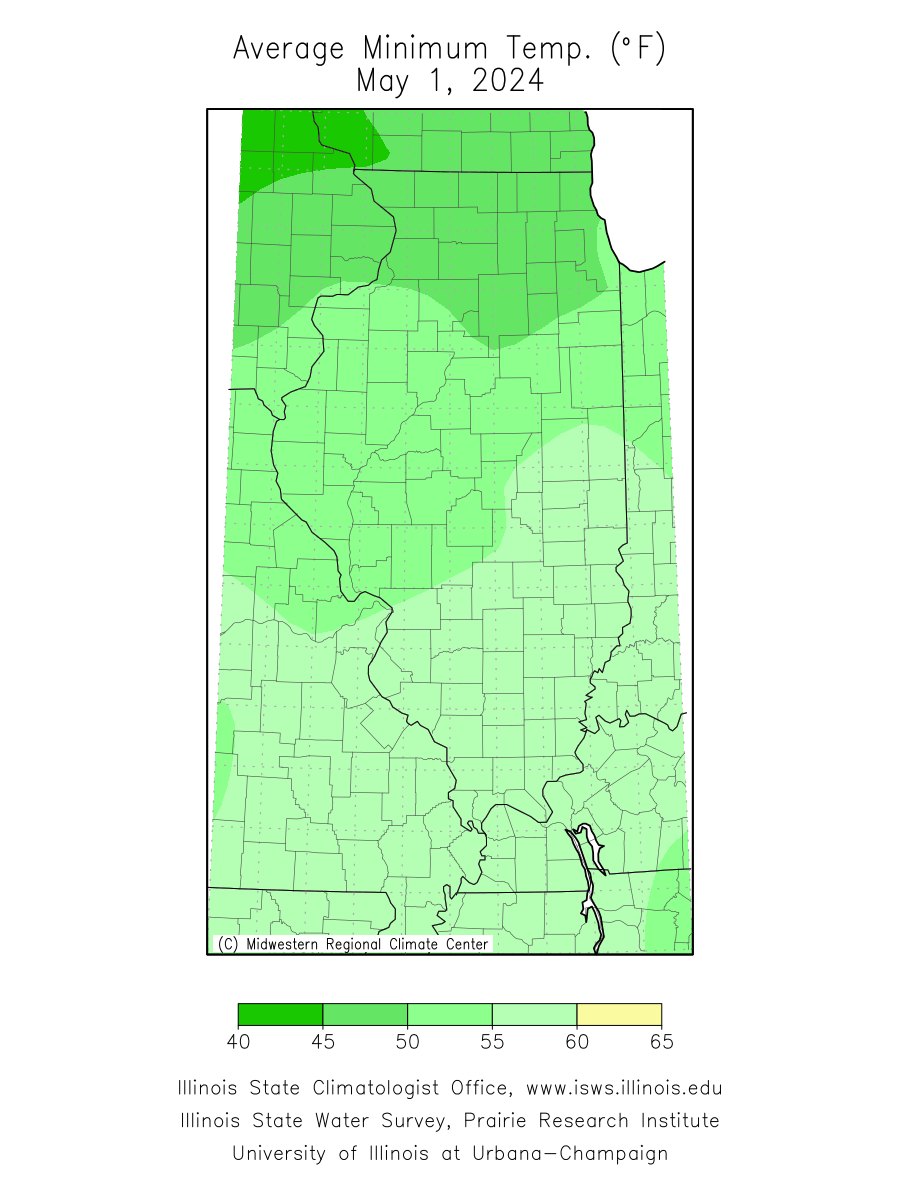 | 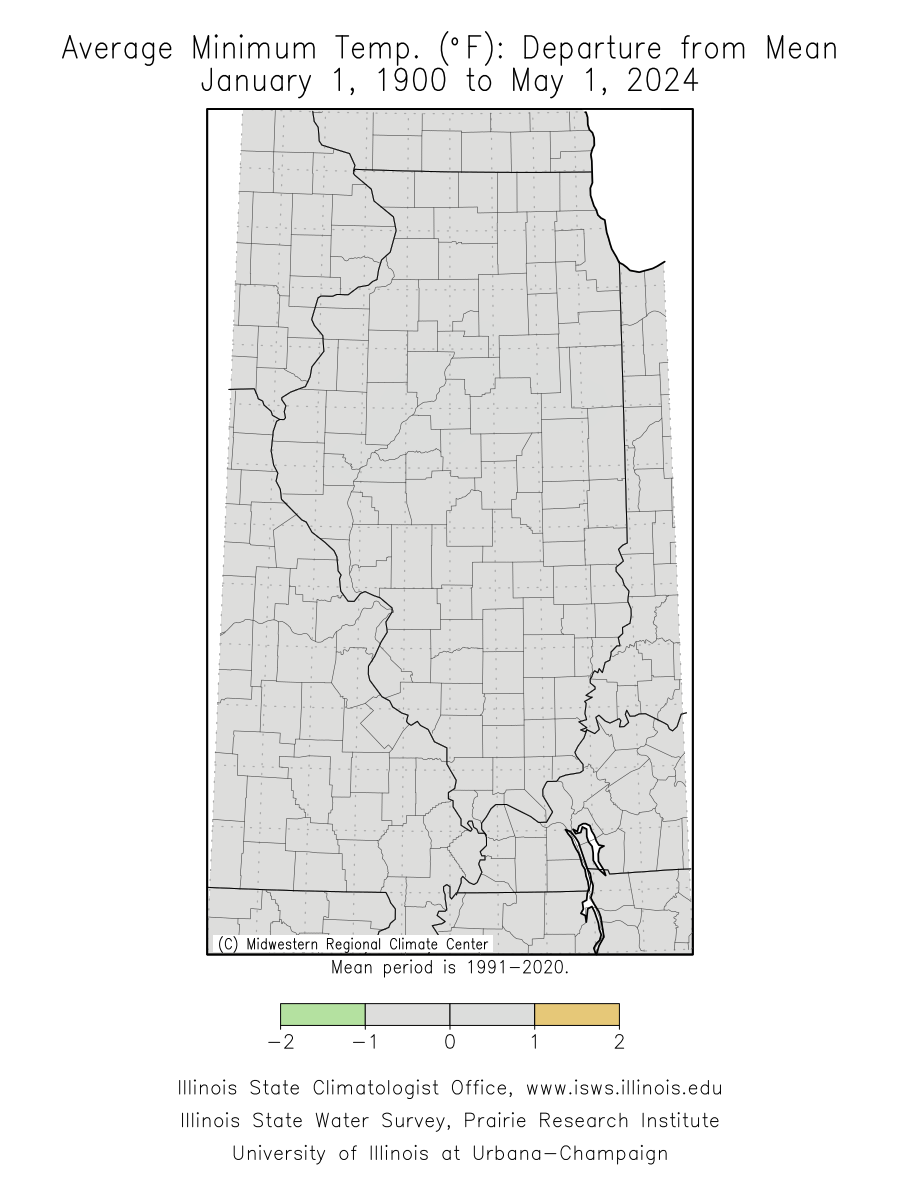 |
| Year to Date | 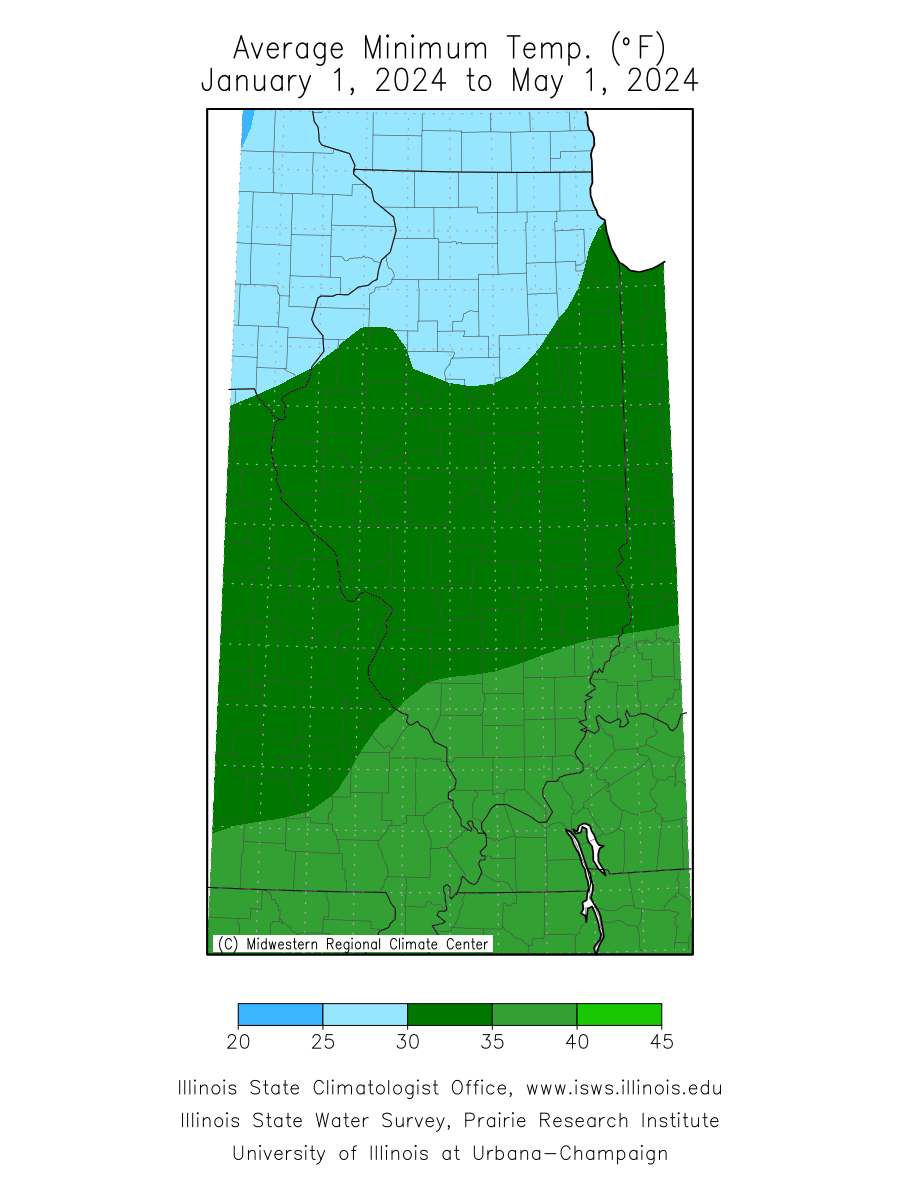 | 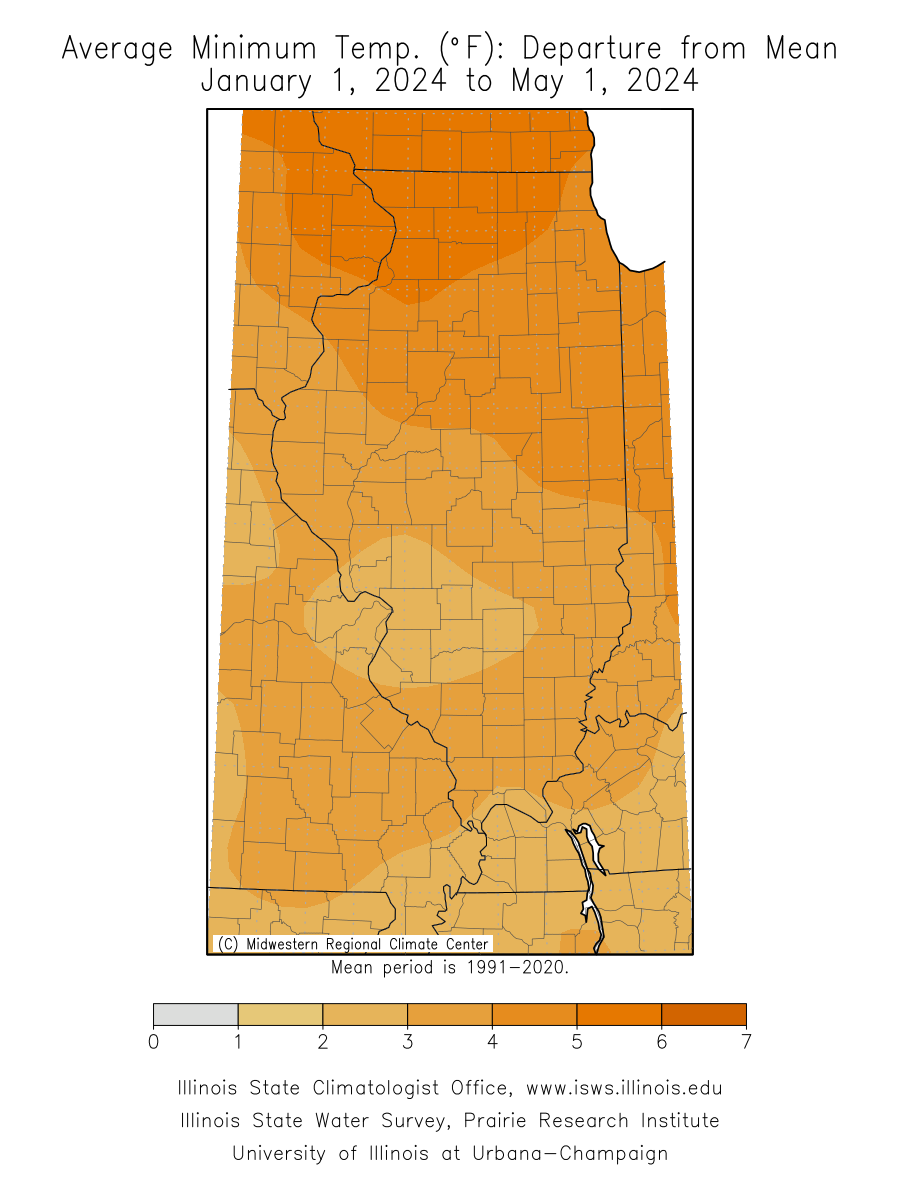 |
Snow
| Total (inches) | Departure from Average (inches) | Percent of Normal |
| Last 7 Days |  | 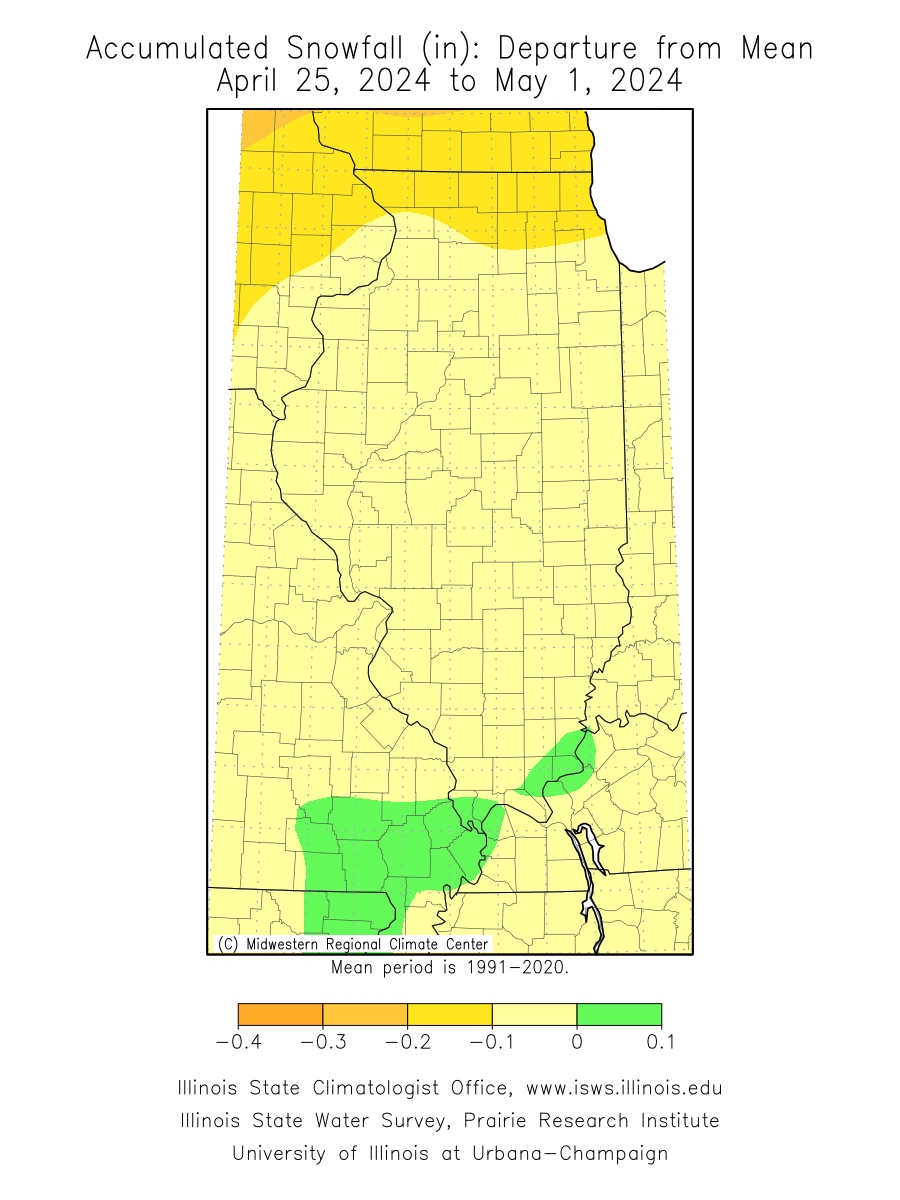 | 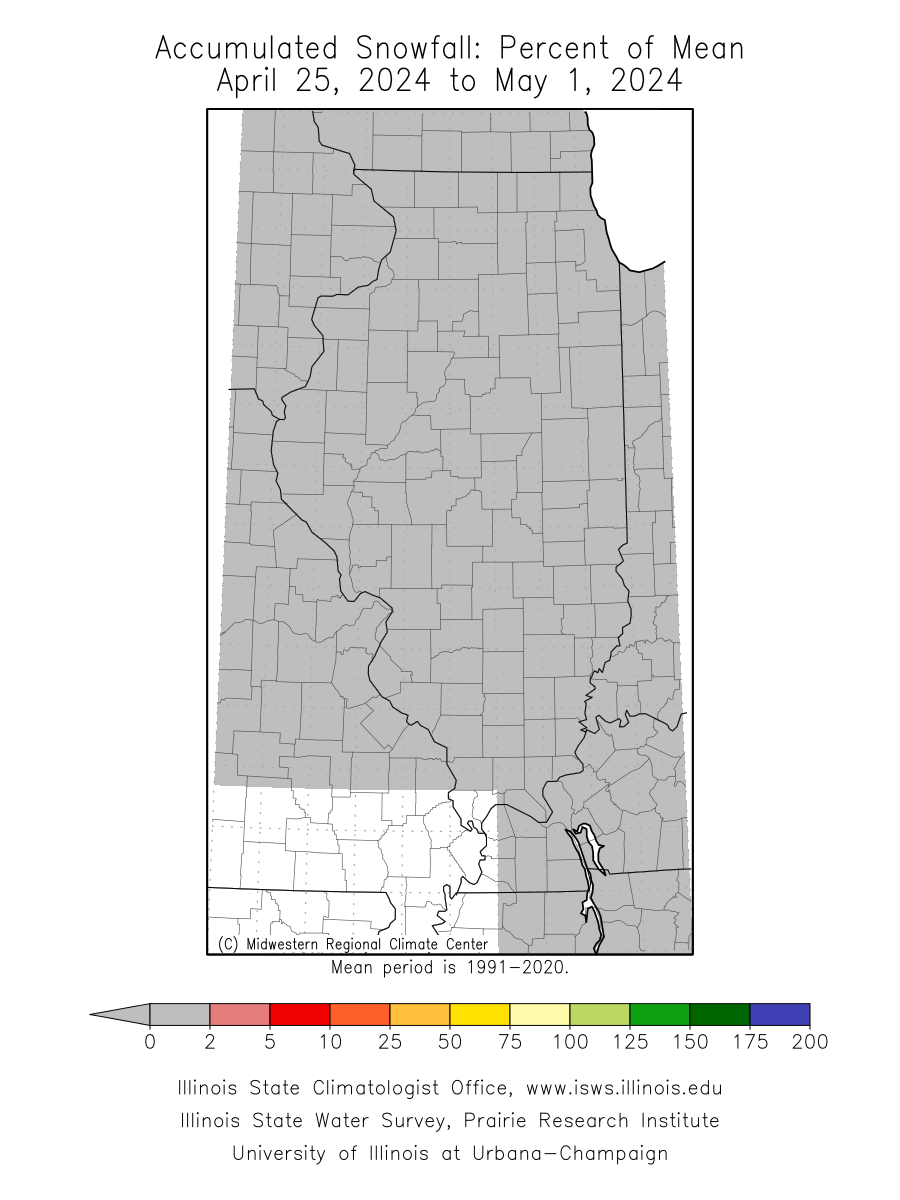 |
| Last 30 Days | 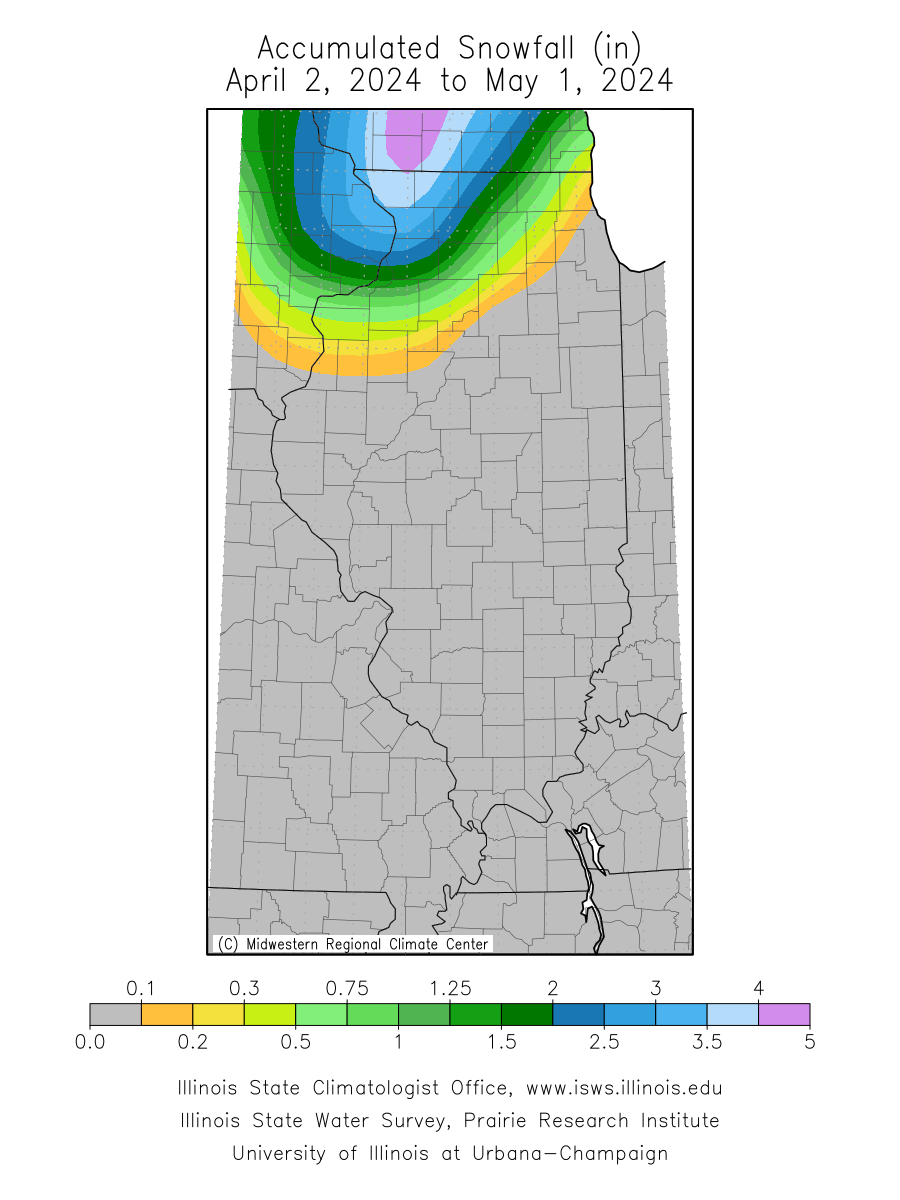 | 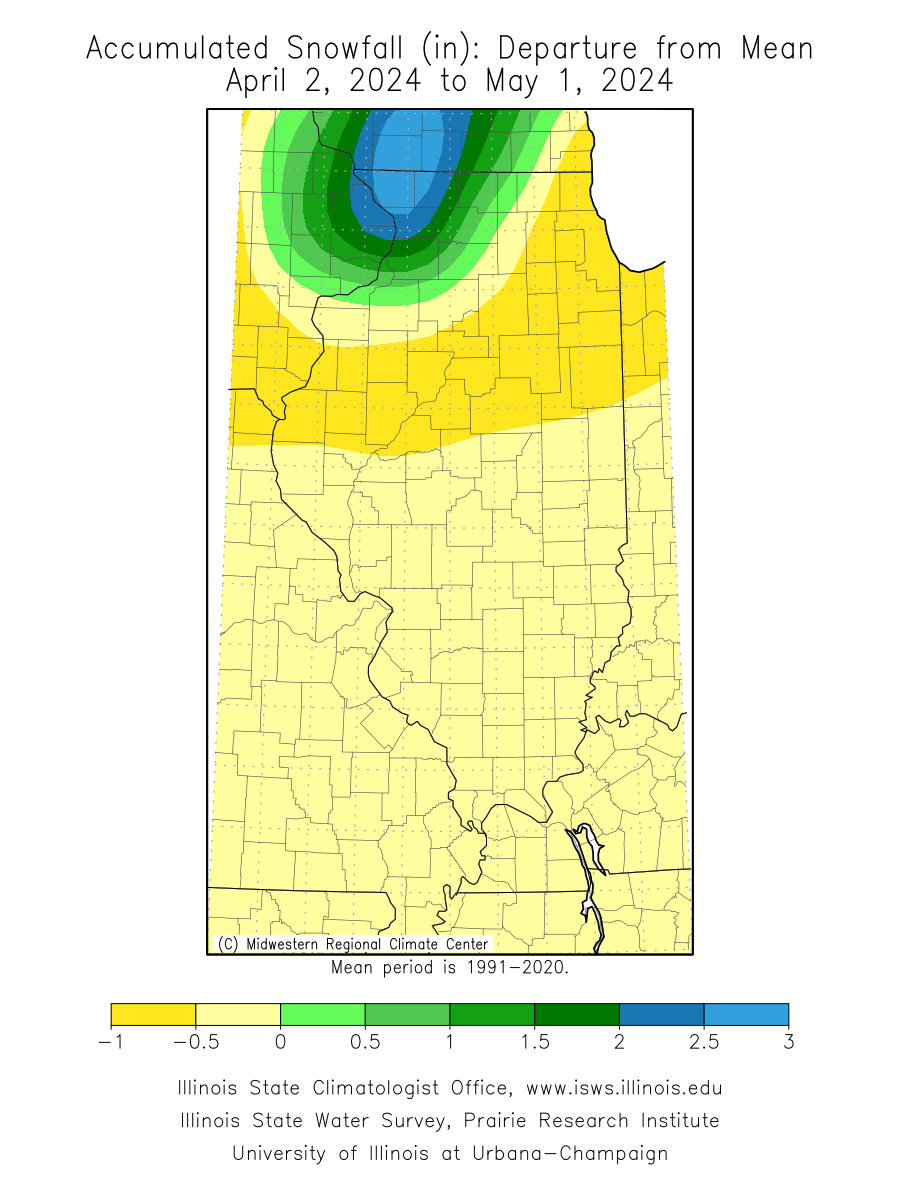 | 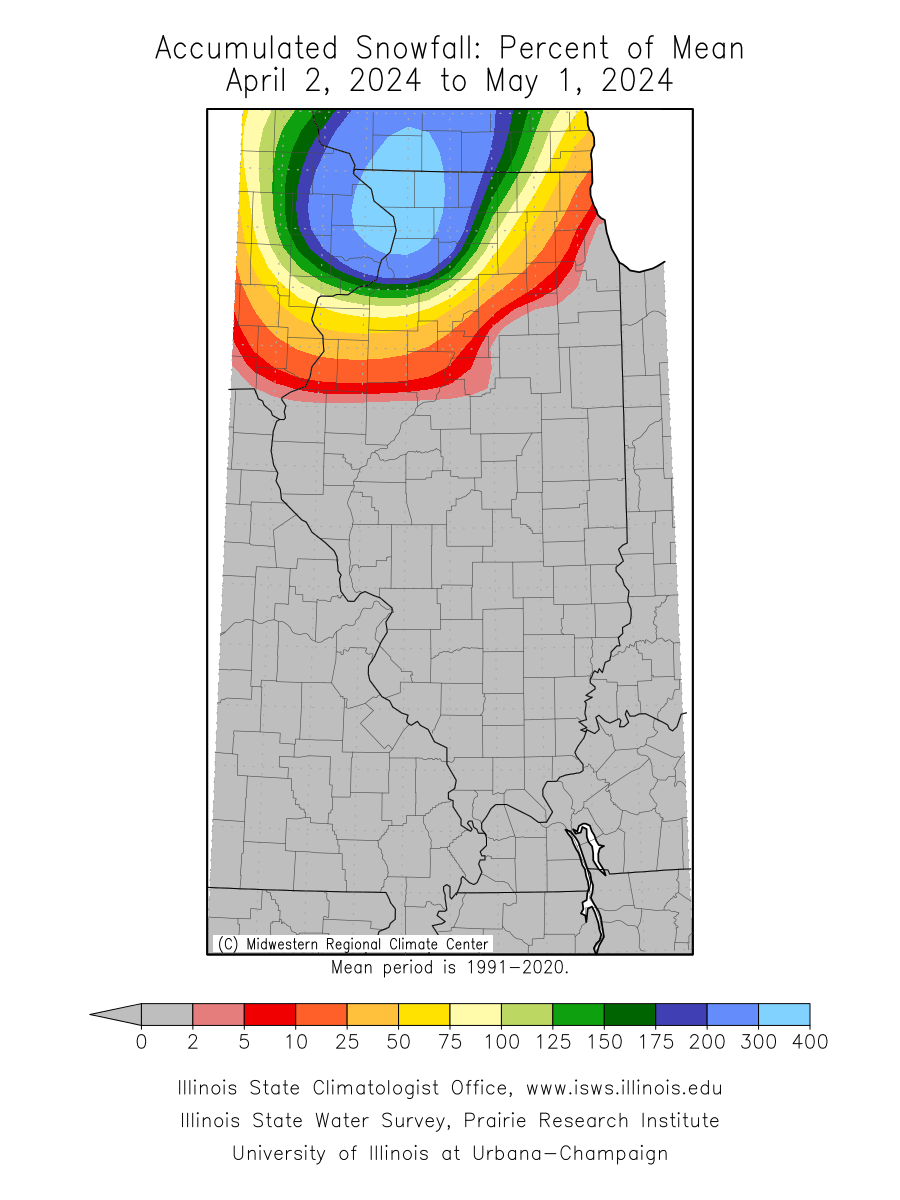 |
| Last 90 Days | 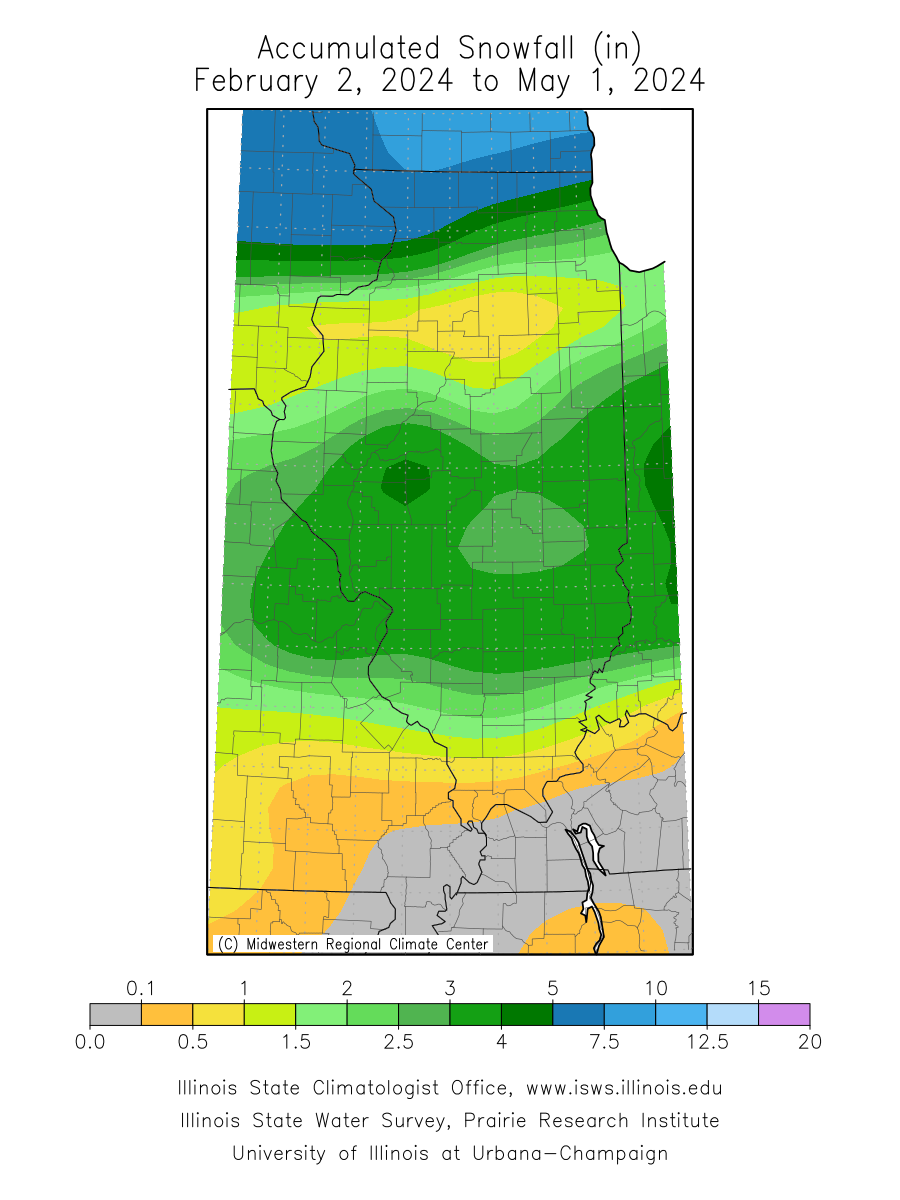 | 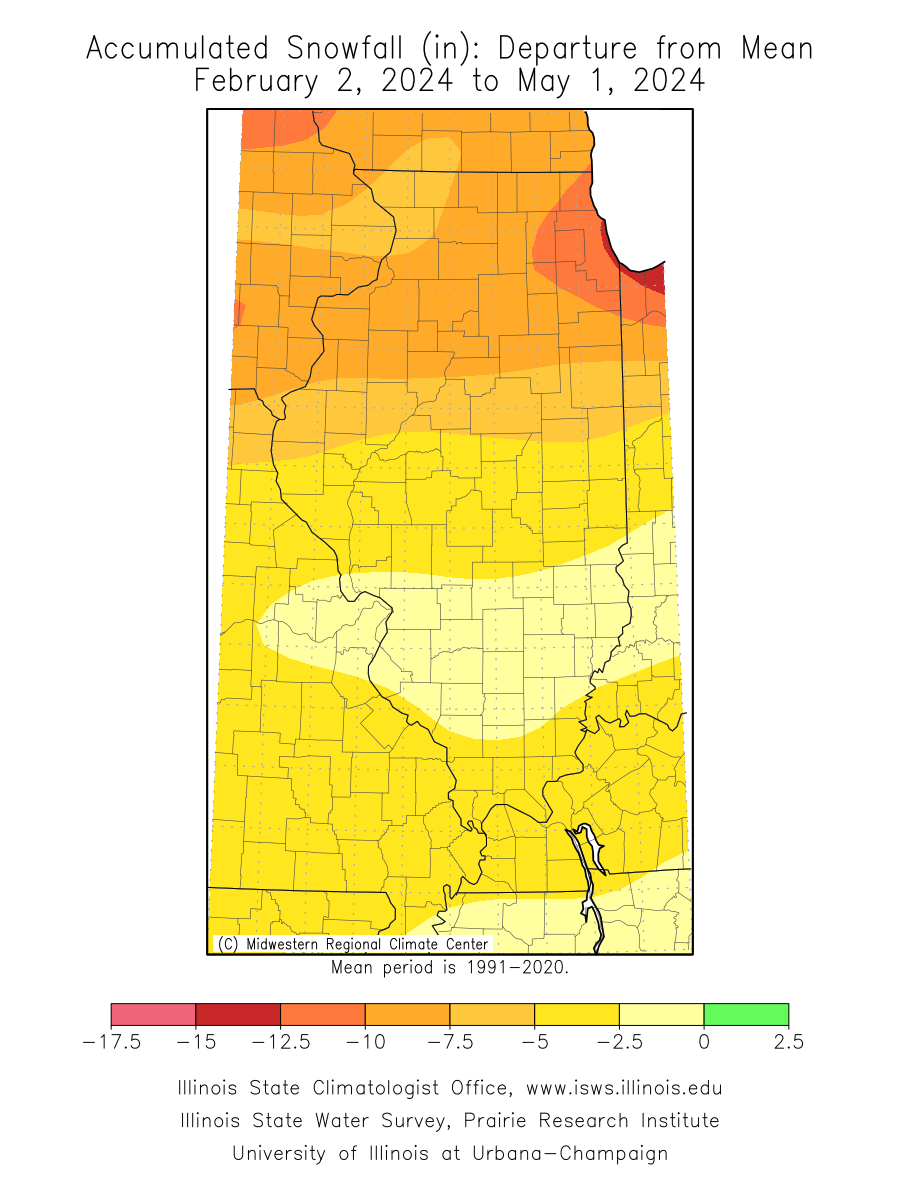 | 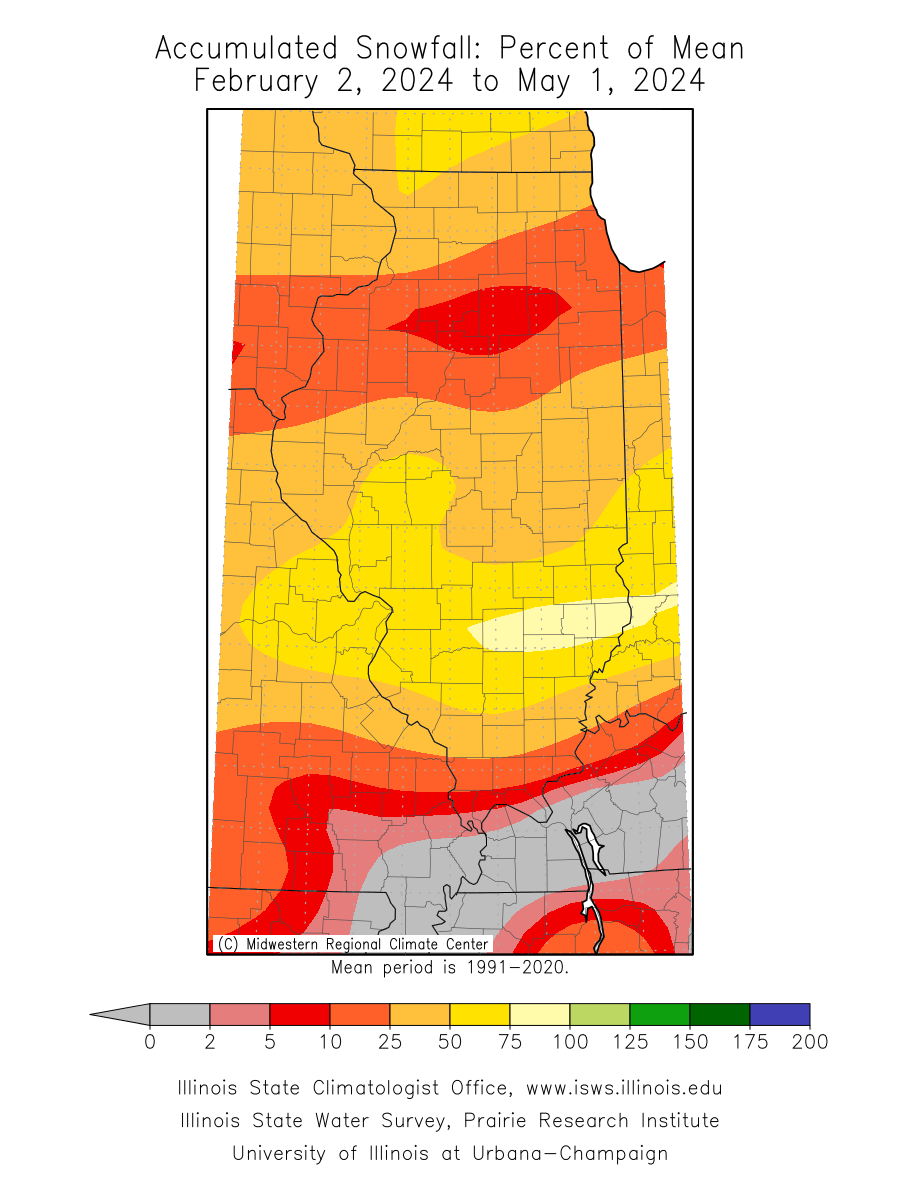 |
| Month to Date | 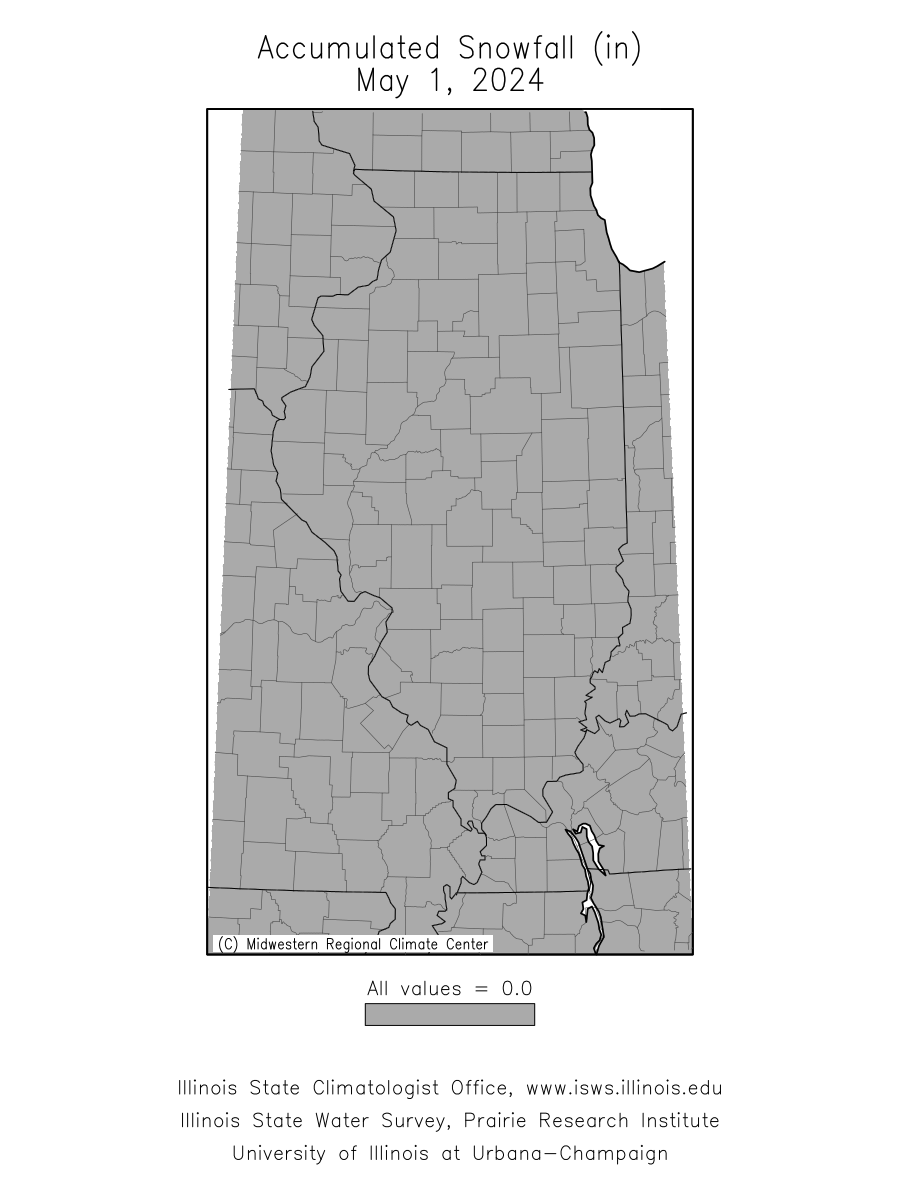 | 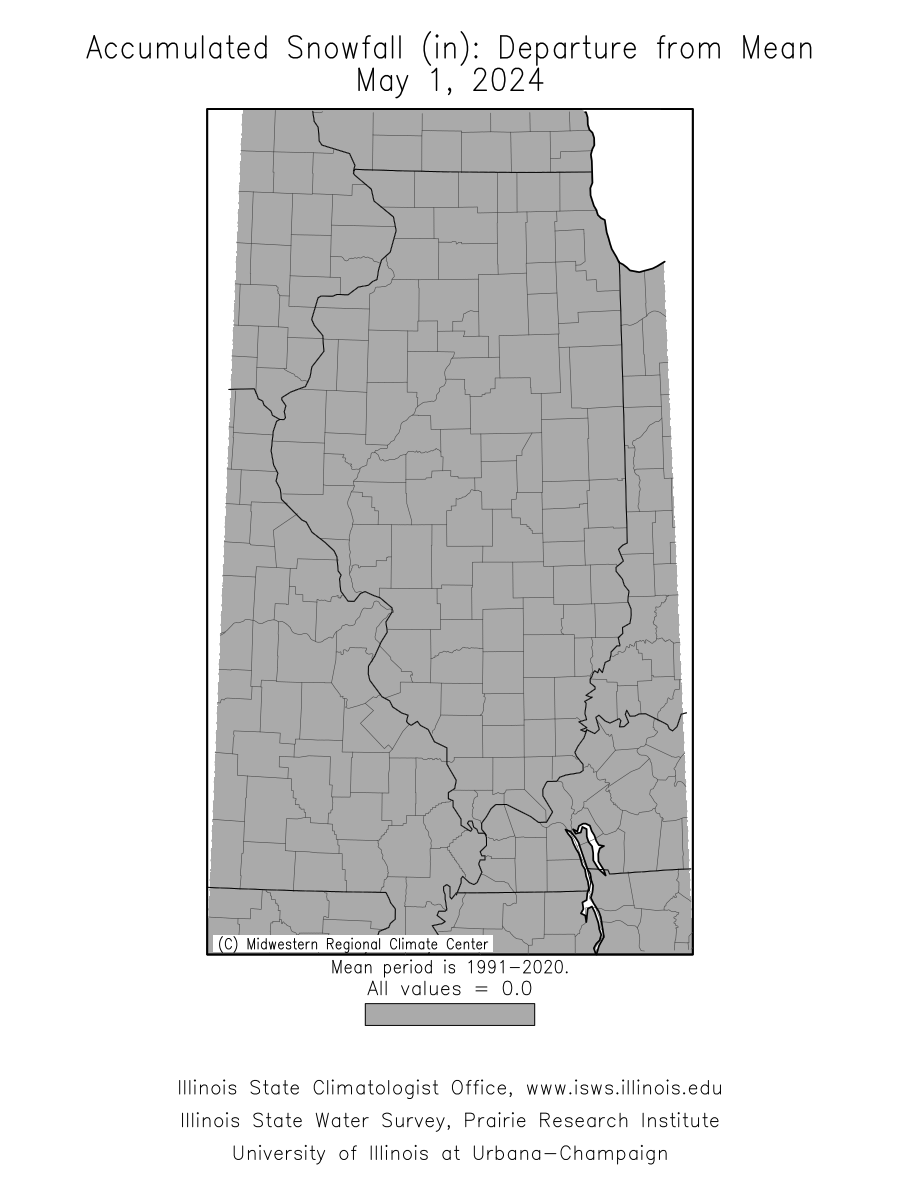 | 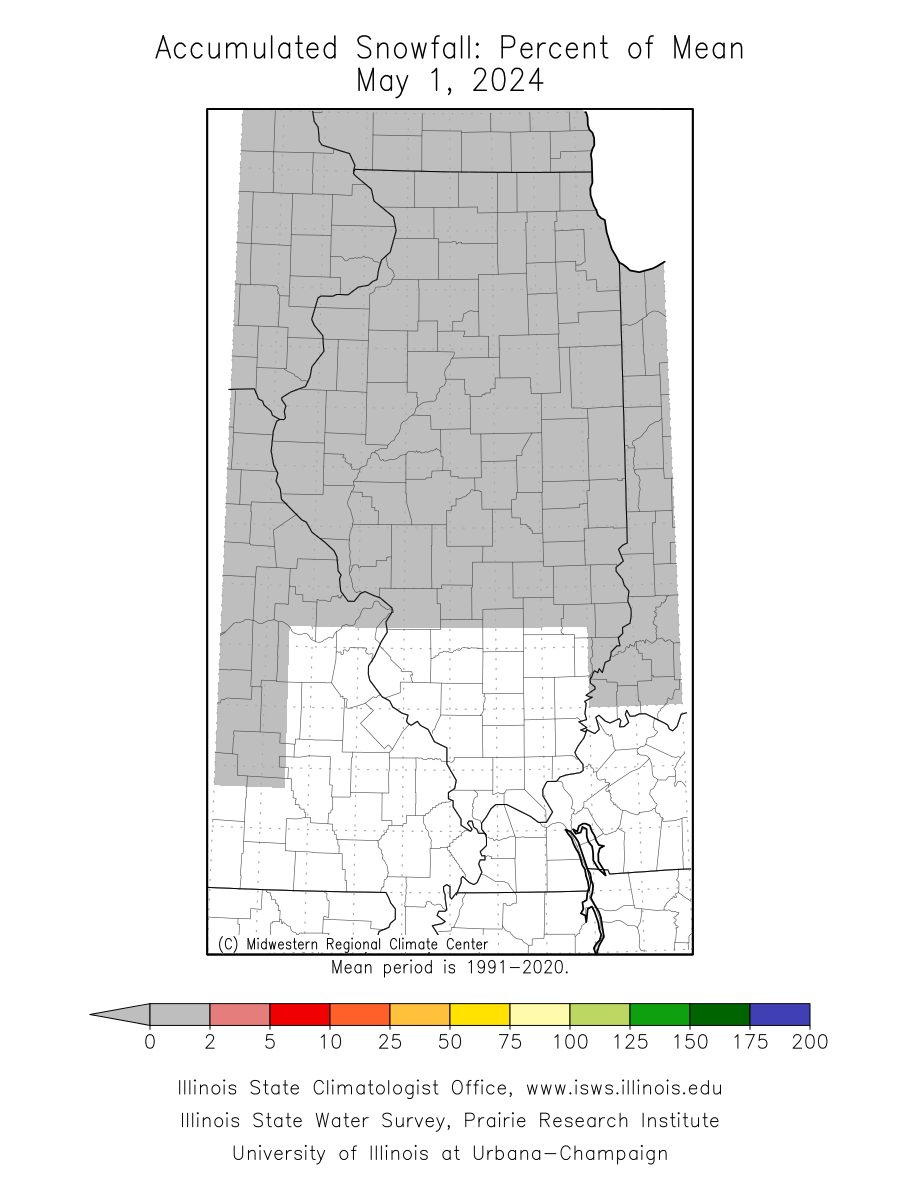 |
| Year to Date | 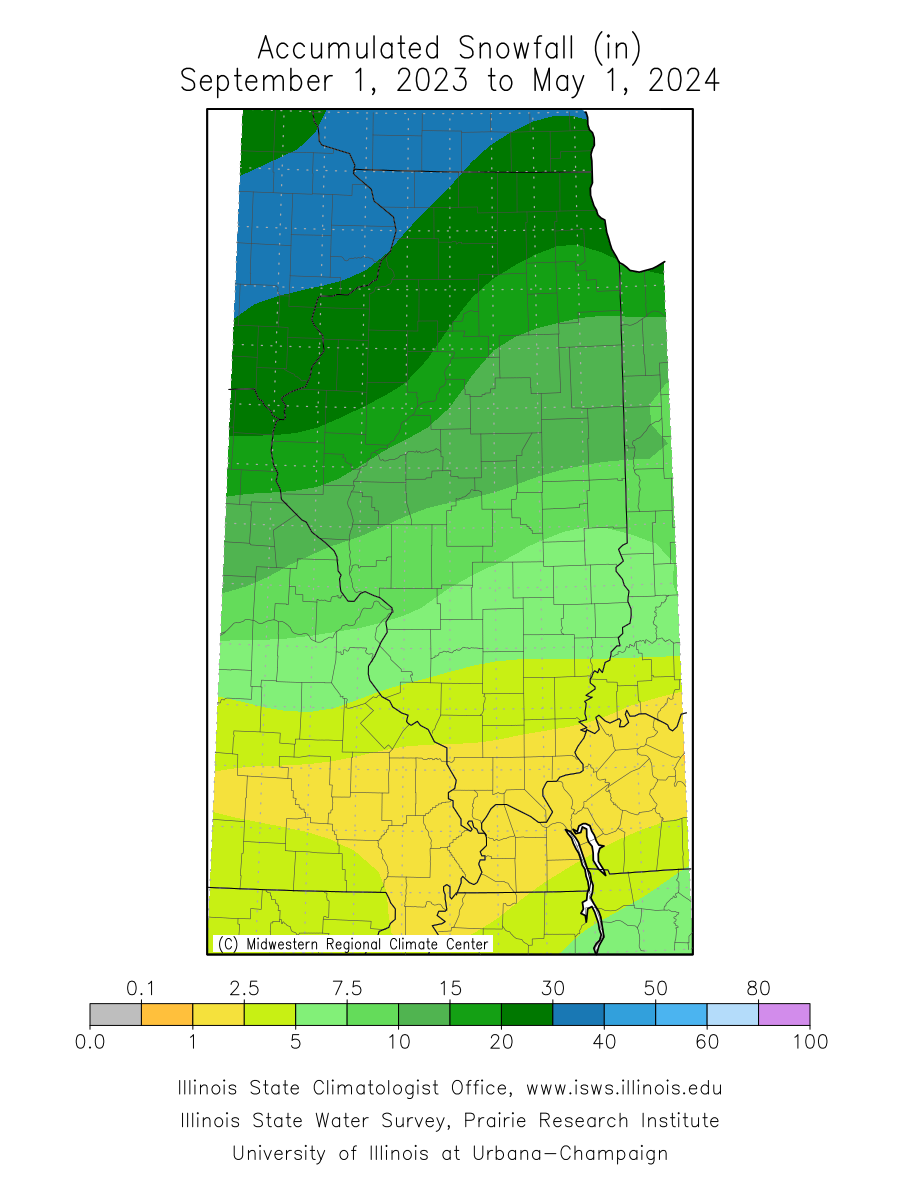 | 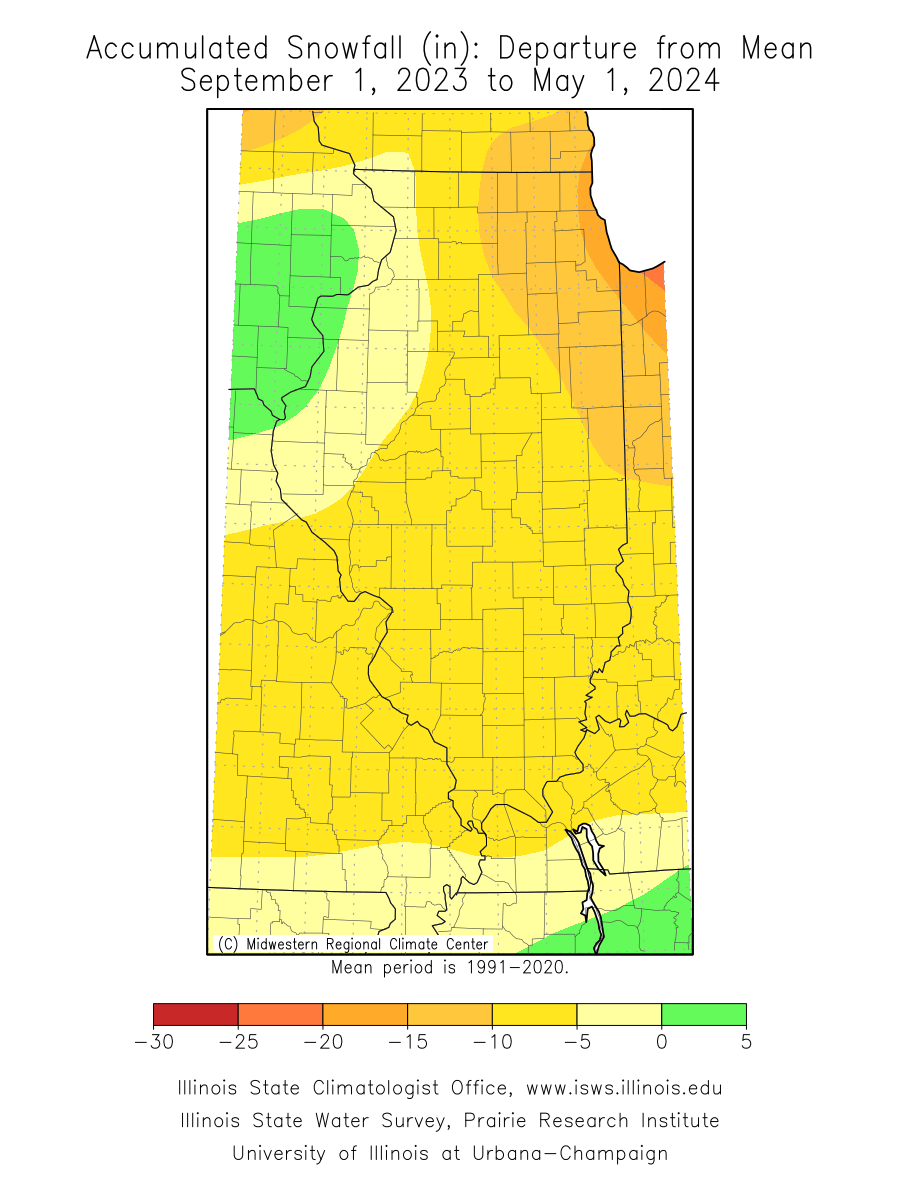 | 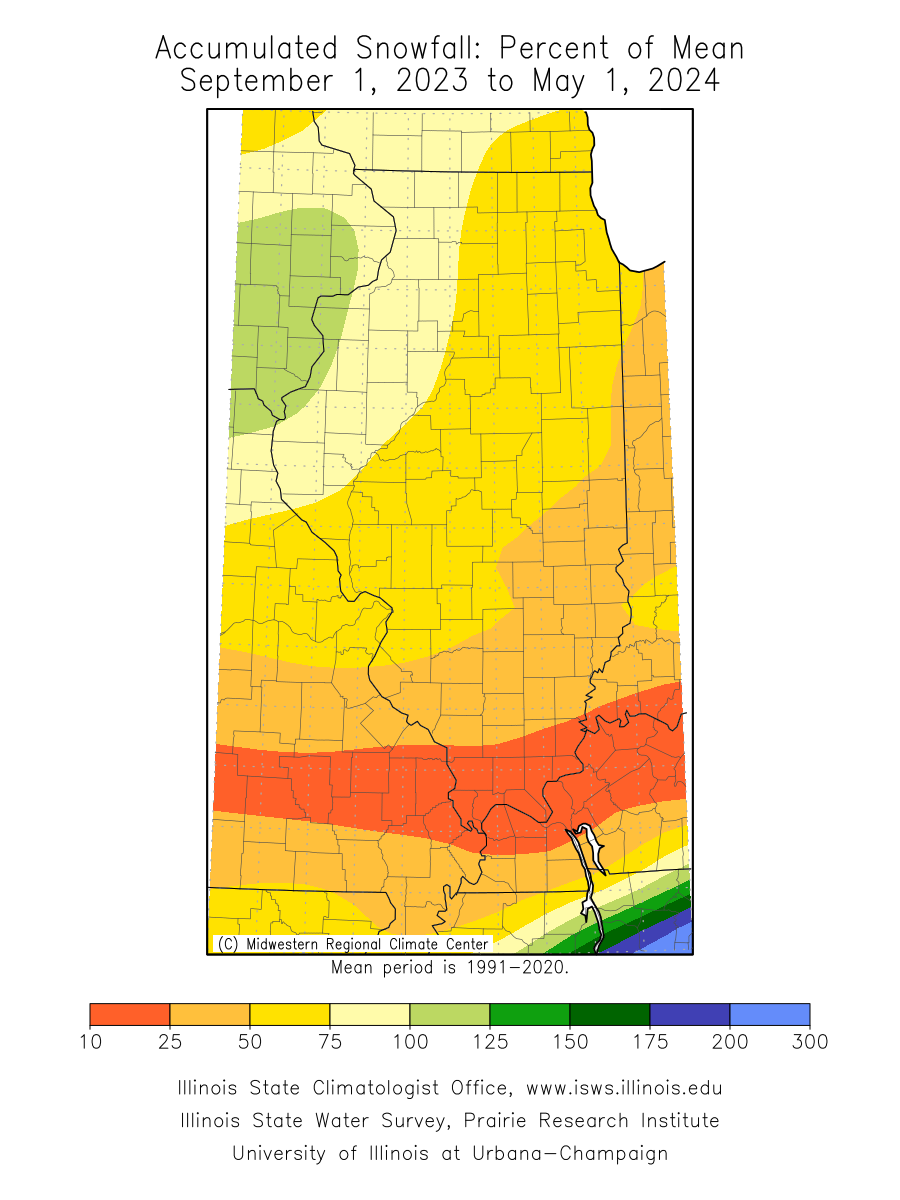 |
Comments
The snowfall year-to-date starts on September 1. Sometimes the daily updates of these maps fail, in which case the maps for the Midwest from the Applied Climate Information System are a possible substitute.
The data used in these products come from the National Weather Service (NWS) Cooperative Observer Program (COOP). This network of more than 11,000 volunteer observers nationwide, using approved instruments and observing techniques, provides high-quality climate data to the nation. The data are archived at the National Centers for Environmental Information (NCEI).
For other detailed precipitation reports of Illinois (rain, snow, and hail), visit the rapidly expanding Community Collaborative Rain, Hail, and Snow network (CoCoRaHS).


